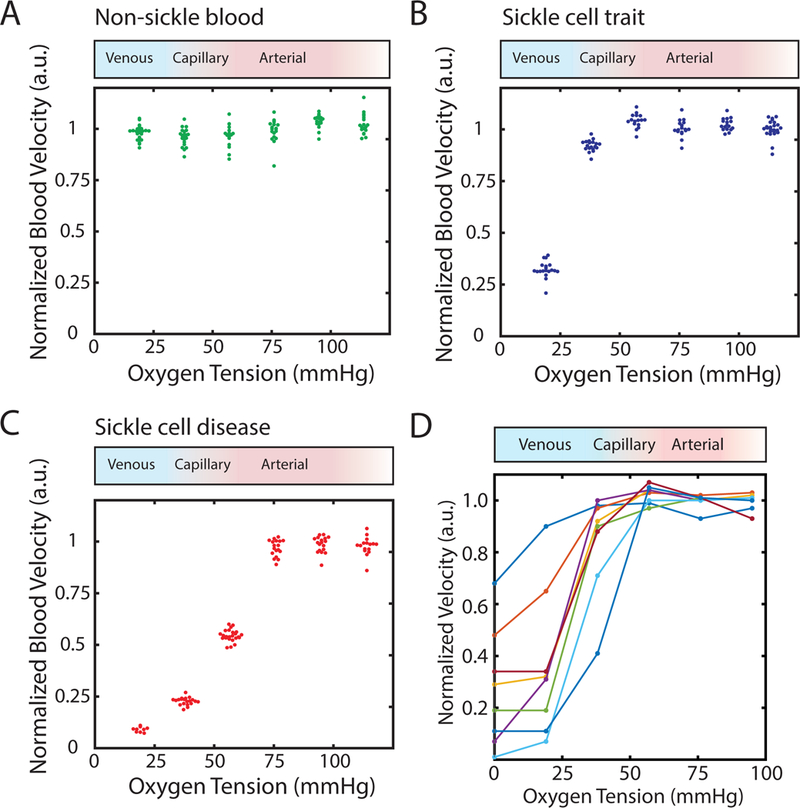
Figure 2.

Rheological behavior of SCT blood becomes oxygen-dependent near venous oxygen tension. (A) Normalized, steady state flow velocity of a non-sickle (genotype AA) individual’s blood sample does not depend on oxygen tension. Oxygen tension was varied in a stepwise manner as described in methods. The red to blue shaded gradient above the plot corresponds to oxygen tensions typically found in arterial circulation (red) and venous circulation (blue). Supra-physiological oxygen tension (white) is also displayed towards the right side of the box. (B) Normalized steady state flow velocity of an individual with sickle cell trait is dependent on oxygen tension. At high oxygen tension (>38 mmHg), velocities are oxygen- independent and exhibit regime I flow behavior. Between 19 and 38 mmHg, flow behavior transitions to regime II where steady state velocities become impaired and are sensitive to oxygen tension. (C) Normalized steady state flow velocity for an individual with homozygous sickle cell disease is dependent on oxygen tension. High oxygen tension (>76 mmHg) results in oxygen-independent regime I flow behavior. Intermediate oxygen tension (>19 mmHg and <76 mmHg or 19<ppO2<76 mmHg) displays impaired, oxygen-dependent regime II flow behavior, and low oxygen tension (<19 mmHg) exhibit severely impaired/nearly occluded regime III behavior. (D) Normalized, median, steady state velocities for 8 different SCT blood samples. Each colored line corresponds to a unique SCT blood sample.
