
Figure 3.
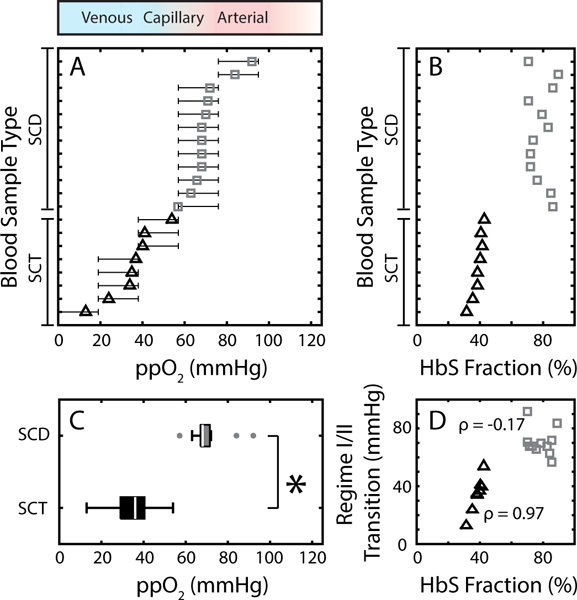
Flow behavior of SCT blood differs from SCD. (A) Regime I/II transition for SCD (gray squares) compared to SCT (black triangles). Confidence intervals are determined as outlined in the methods. The red to blue to white color gradient bar above the plot corresponds to typical oxygen tensions found in arterial circulation (red), venous circulation (blue), and supra-physiological oxygen tension (white). (B) Bulk HbS fraction for both SCD blood samples (gray squares) and SCT blood samples (black triangles) as measured by HPLC. SCD blood samples are non-transfused and all have higher HbS% compared to SCT blood samples. (C) Box plot comparing the oxygen tension at which the regime I/II transition occurs for SCD (gray box) with SCT (black box) blood samples. Non-parametric analysis (Mann Whitney-U) tests found significant differences between the two groups (p=0.0023). (D) Oxygen tension at which the regime I/II transition occurs as a function of HbS fraction for SCD (gray squares) and SCT (black triangles) blood samples. SCD blood did not exhibit a strong correlation between the regime I/II transition and HbS% (Pearson correlation coefficient, ρ=−0.17), but SCT samples displayed a strong, positive correlation (ρ=0.97).