
Figure 4.
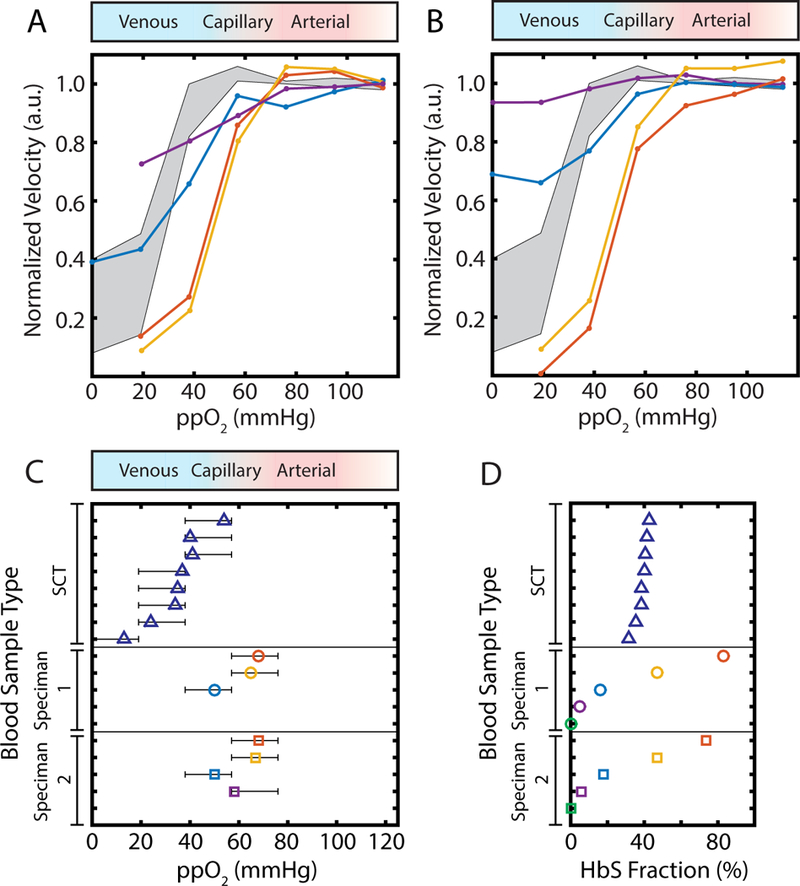
Oxygen-dependence of rheology for transfused SCD compared to SCT. (A,B) Normalized, median velocity under steady state conditions for the two transfusion blood samples we measured. Simulated transfusion specimens shown are ~5–6% (purple), ~16–18% (blue), ~45–48% (orange), and ~70–85% (red) genotype SS blood by volume. Grey, shaded region shows the interquartile range of normalized blood velocity in response to oxygen tension for all SCT blood samples. Blue to red to white color gradient bar above plot represents typical oxygen tension found in venous, arterial, and supraphysiologic circulation respectively. (C) Oxygen tension at which the regime I/II transition occurs for SCT (blue triangles) and two unique, simulated transfusion experiments (colored circles and squares, with HbS % corresponding to the colors specified in A,B). Blue to red to white color gradient bar above plot represents typical oxygen tension found in venous, arterial, and supraphysiologic circulation respectively. Confidence intervals for each regime I/II transition are determined as outlined in methods. (D) Bulk hemoglobin S fraction as quantified by HPLC is presented for SCT (blue triangles) blood samples. For simulated transfusions, HbS fraction was calculated based on the native HbS fraction of the genotype SS blood sample, hematocrit for both SS and AA samples, and the volume of blood transfused.