
Fig. 5.
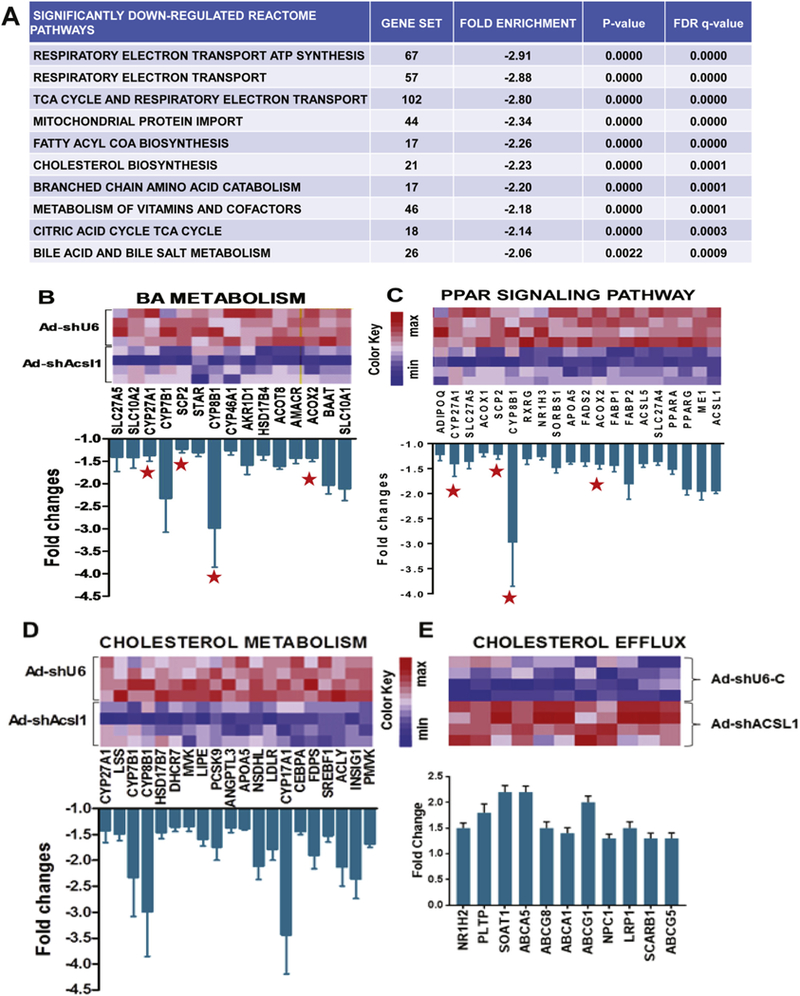
GSEA pathway analyses for lipid categories significantly enriched in a genome-wide expression profiling of repressed or increased genes caused by ACSL1 deficiency.
(A) Top 10 reactome pathways that are enriched in genes downregulated in livers of Ad-shAcsll injected mice (n = 4) compared to that of Ad-shU6-C mice (n = 4).
(B–C) Heatmap illustrations of changes in gene expression of BA metabolism and PPAR signaling pathways. Graphs show fold changes in all genes within the indicated pathway that have a p value < 0.05. A red star sign marks the 4 genes in both pathways.
(D–E) Heatmap illustrations of down regulation of gene expression involved in cholesterol biosynthesis pathway and increased expression of genes in cholesterol excretion pathway. Graphs show fold changes in all genes within the indicated pathway that have a p value < 0.05.