
Fig. 6.
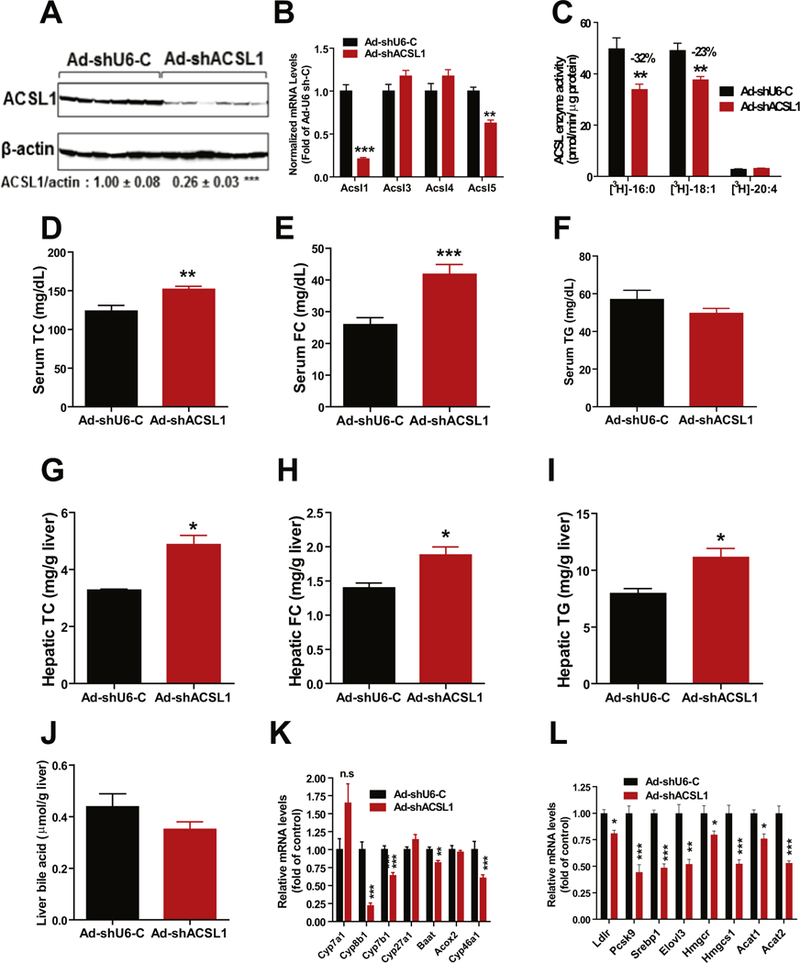
Effects of knocking down hepatic ACSL1 in mice fed a NCD. Male C57BL/6J mice fed a NCD were injected with Ad-shAcsl1 or Ad-shU6-C. After 11-days of adenoviral injection, mice were sacrificed and serum and livers were isolated at the termination. All data are mean ± SEM of 6 mice per group.
(A) Western blot analysis of hepatic ACSL1 protein and β-actin levels. The protein abundance of ACSL1 was quantified and normalized with signals of P-actin using Alpha View Software.
(B) Real-time PCR was conducted to determine the relative expression levels of ACSL isoform mRNAs after normalization with GAPDH mRNA levels.
(C) Total ACSL enzymatic activity in 4 μg of liver homogenate using [3H] labeled PA, [3H] labeled OA and [3H] labeled AA as substrates.
(D) Serum TC.
(E) Serum FC.
(F) Serum triglycerides.
(G) Liver TC.
(H) Liver FC.
(I) Liver TG.
(J) Liver total BA amounts.
(K, L) Real-time PCR measurement of hepatic mRNA levels of indicated genes in BA synthesis and cholesterol metabolism.
In A–L, Significance was determined by Student’s t-test. n = 6 mice per group. *p < 0.05, **p < 0.01, and ***p < 0.001.