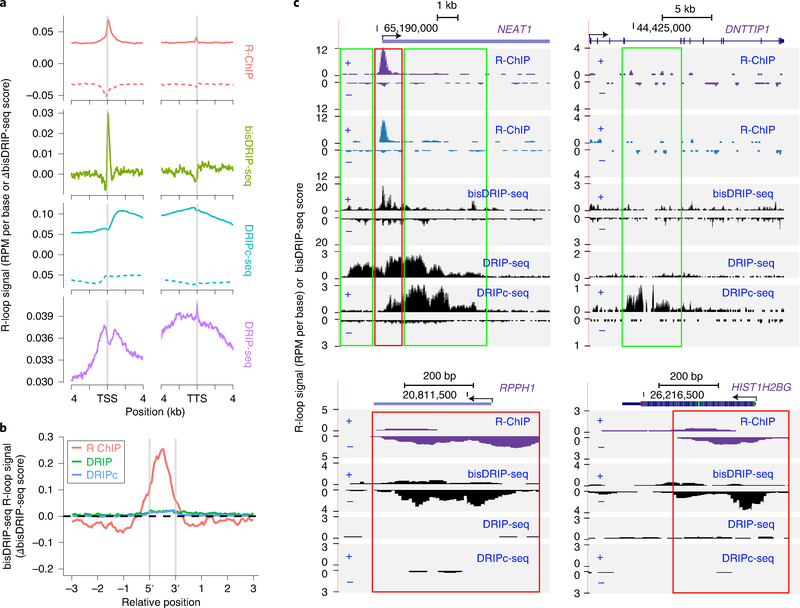
Fig. 2 |. Comparison of R-ChIP and S9.6-based methods.
a, Meta-gene analysis of signals detected by R-ChIP4, bisDRIP-seq42, DRIPc-seq2 and DRIP-seq15 at the ±4-kb region of TSS and TTS, respectively. Note that y-axis units are different for individual methods. R-loop signals are measured in terms of reads per million (RPM) per base by R-ChIP, DRIPc-seq and DRIP-seq, or the difference between template and non-template strand bisDRIP-seq scores by bisDRIP-seq42. bisDRIP-seq signals above or below 0 indicate the existence of R-loops on the forward or reverse strand. For R-ChIP and DRIPc-seq, solid and dotted lines represent potential R-loop signals from the forward and reverse strands, respectively. b, bisDRIP-seq R-loop signals at peak regions defined by R-ChIP, DRIPc-seq (DRIPc) and DRIP-seq (DRIP) data. c, Signals detected by R-ChIP (purple for K562 cells and blue for HEK293T cells), bisDRIP-seq, DRIPc-seq and DRIP-seq at representative genomic loci. Regions with consistent signal profiles between R-ChIP and bisDRIP-seq are highlighted by red rectangles, whereas those detected only by DRIP-seq or DRIPc-seq are highlighted by green rectangles. TSS, transcription start site; TTS, transcription termination site.

