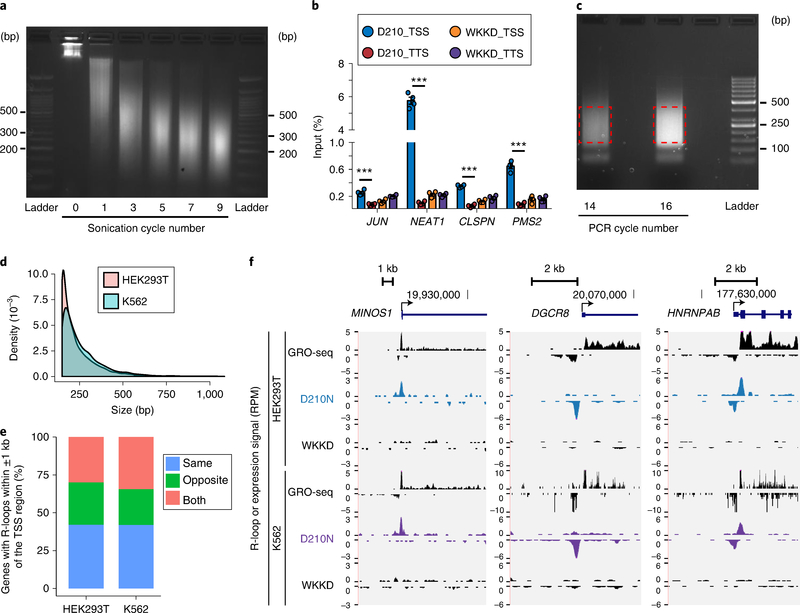
Fig. 3 |. Expected results of R-ChIP.
a, Size distribution of chromatin fragments before and after different numbers of sonication cycles is assayed on a 2% (wt/vol) agarose gel. As denoted, seven cycles of sonication enable the majority of DNA to be sufficiently fragmented. b, The R-ChIP-qPCR signals relative to input for several genomic loci on K562 cells are shown as mean ± s.e.m. (n = 4, P < 0.001, two-sided t test). c, Amplification of an R-ChIP library by different numbers of PCR cycles. d, Size distribution of R-ChIP peaks in HEK293T and K562 cells. e, Out of all genes with R-loops detected within ±1 kb of the TSS region (false-discovery rate <0.01; signal enrichment >5-fold), the percentages of three groups of genes are shown, for which R-loops are identified in the same, opposite or both directions of transcriptional activity. f, Snapshots of three representative R-loop-containing genomic loci corresponding to the three gene groups in e. R-ChIP (D210N) and control (WKKD), as well as GRO-seq signals, are displayed for HEK293T (ref. 4) and K562 (ref. 68) cell lines.

