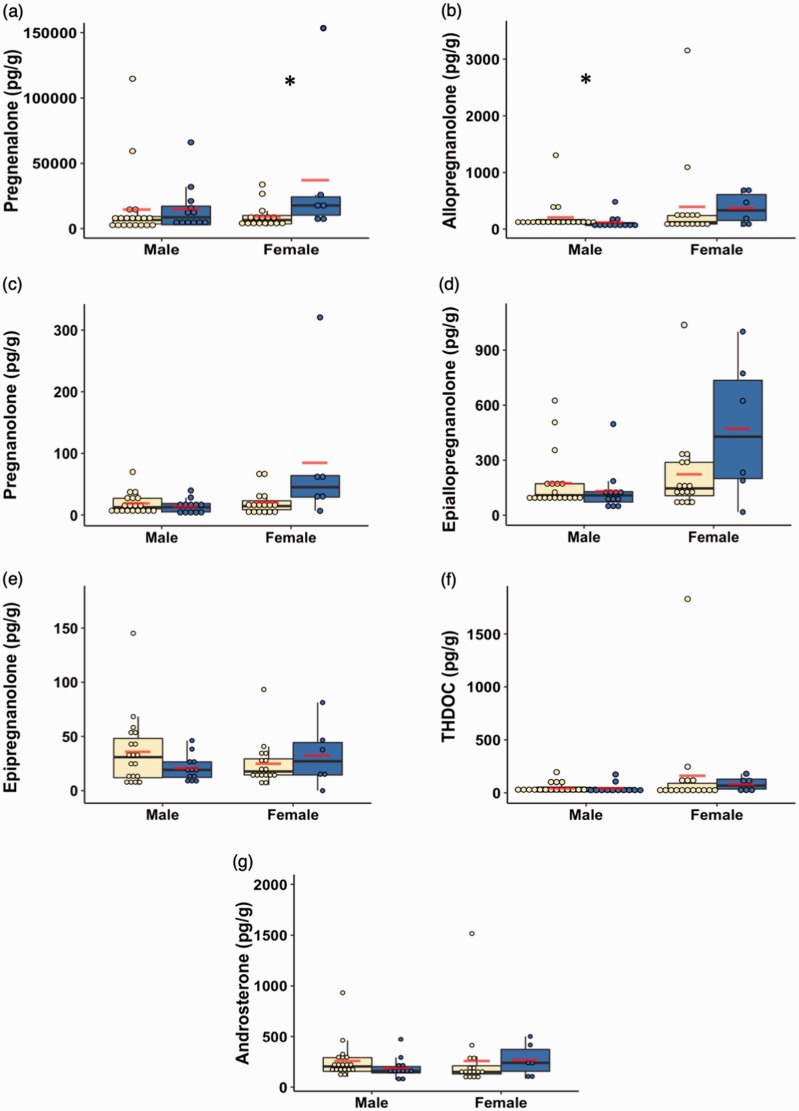
Figure 1.
Box and dot plots of the neurosteroid concentrations in units of (pg/g) (a. pregnenolone, b. allopregnanolone, c. pregnanolone, d. epiallopregnanolone, e. epipregnanolone, f. THDOC, g. androsterone) stratified by sex and group. Yellow indicates control subjects, and blue indicates subjects with post-traumatic stress disorder. The lines indicate median values, while the lower and upper box boundaries indicate first and third quartiles, respectively. The red lines indicate group mean values. *p < 0.05.
THDOC: tetrahydrodeoxycorticosterone.

