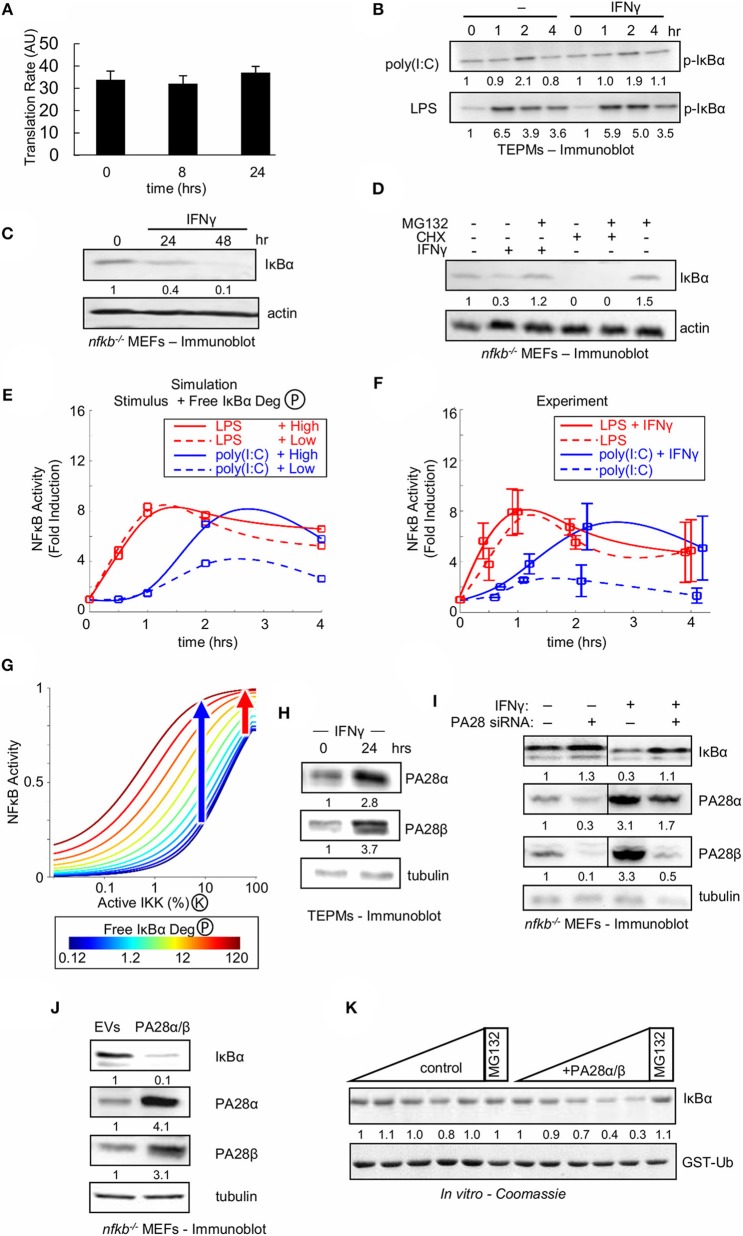
Figure 5.
Type II interferon amplifies weak NFκB activating stimuli by enhancing free IκBα degradation. (A) IκBα translational synthesis rates in naïve and IFNγ-conditioned TEPMs as revealed by 35S-Met pulse assay. Average and standard deviation of three biological replicates are shown. (B) Immunoblot for p-IκBα in TEPMs exposed to either LPS or poly(I:C) with or without IFNγ priming. (C) Immunoblot of “free” IκBα compared to an actin control in MEFs deficient in canonical NFκB proteins RelA, cRel and p50 (termed “nfkb−/−”) exposed to IFNγ. (D) Free IκBα levels in nfkb−/− MEFs compared to an actin control. Immunoblot of lysates produced from MEFs exposed to 24 h priming with IFNγ or 4 h treatment with ribosomal inhibitor CHX, and followed by addition of proteasome inhibitor MG132. (E) Predictions from the Simplified Model of NFκB (SiMoN) with low (10% at peak) IKK activity, representative of poly(I:C) (blue), and high (40% at peak) IKK activity, representative of LPS. Values were calculated at 0, 0.5, 1, 2, and 4 h and fit with a smoothing spline for consistency with experimental time points. Free IκBα degradation was modulated from the default value (dashed lines) to 10-fold higher (solid lines) based on quantification of immunoblot in 5B. (F) Time course of NFκB induction (quantitated from EMSAs) in naïve or IFNγ-conditioned TEPMs stimulated with poly(I:C) and LPS. (G) Nuclear NFκB activity calculated using SiMoN as a function of bound IκBα degradation (IKK-activity, x-axis) and free IκBα degradation (colored lines). The blue and red arrows indicates the free IκBα degradation-dependent increase in NFκB activity for low and high IKK activities indicative of poly(I:C) and LPS, respectively. (H) Immunoblots of proteasome activator 28 (PA28) levels in TEPMs following exposure to IFNγ. (I) Immunoblots for IκBα and proteasome activator 28 (PA28) in nfkb−/− MEFs. Both conditions were repeated following PA28 siRNA-mediated knockdown. (J) Immunoblot of IκBα and PA28 levels in nfkb−/− MEFs transduced with retroviral transgenes. (K) Coomassie-stained SDS-PAGE showing free IκBα and PA28α/β levels following incubation with increasing amounts of purified 20S proteasome (upper panel) contrasted with GST-ubiquitin levels (lower panel), which serves as a negative control. (B–D) show a dataset representative of at least three biological replicates (H–K) show a dataset representative of two biological replicates. Quantitations are relative to basal or t = 0 activity, which is set to 1.

