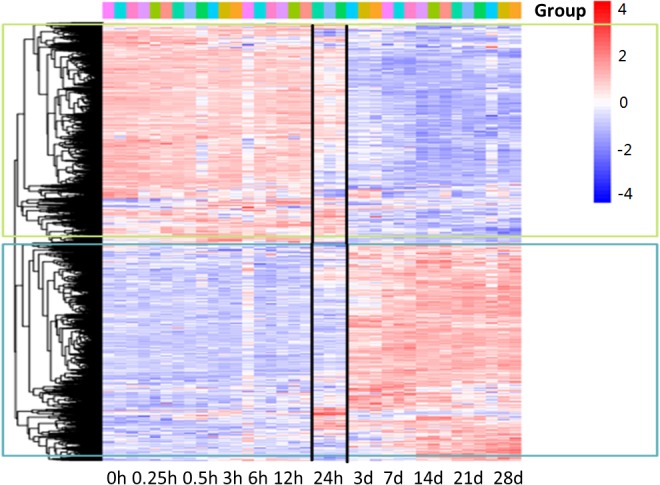
FIGURE 1.

Gene-expression analysis during denervation-induced muscle atrophy. Heatmap showing distinct expression profiles of DEGs during tibialis anterior muscles atrophy induced by denervation. Blue and red indicate lower and higher transcript abundance, respectively. Bar at the top right corner represents log2 transformed values.
