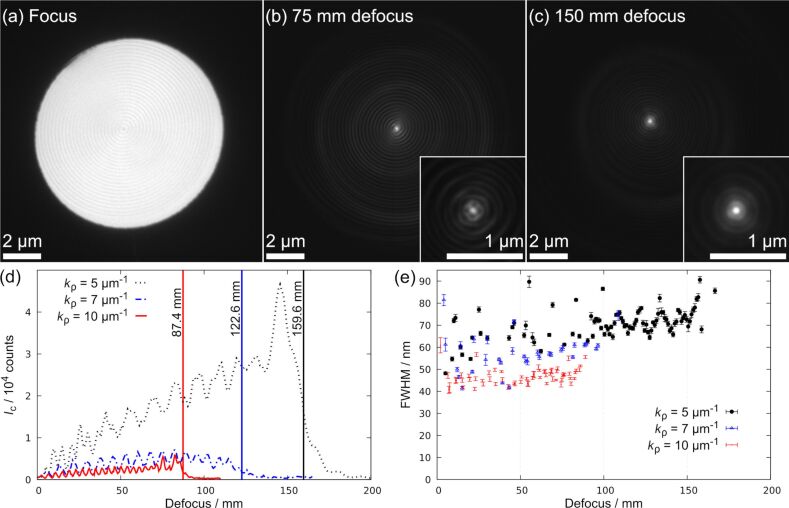
Figure 6.
TEM images in LM mode of a PM placed in the object plane are shown in (a) to (c). (a) The image of the focused PM (kρ = 5 µm−1) shows faint amplitude contrast. Defocusing the diffraction lens to (b) 75 mm and (c) 150 mm displays the preserved shape of a BB upon propagation. The intensity in (b) and (c) is shown on a logarithmic scale to visualize the bright center and the outer rings. The inserts display the center of the respective image. Since astigmatism was corrected for the planes shown in (a) and (c) the intermediate region in (b) shows slight astigmatism. (d) The measured intensity in the central peak is plotted against the nominal defocus. Vertical lines mark the measured values for zmax for PMs with different kρ. (e) FWHM of central maximum as a function of defocus for PMs with different kρ. Error bars correspond to the fitting error of the Gaussian function.

