Figure 8.
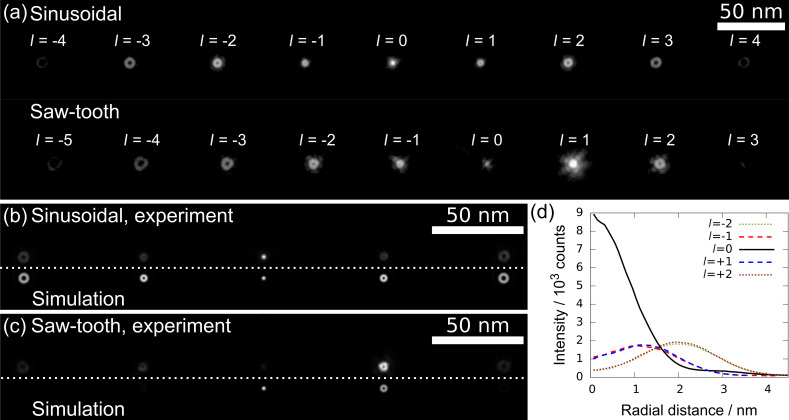
(a) Generated VBs in the object plane of a Philips CM200 for the sinusoidal and saw-tooth pattern, respectively. The images are displayed in logarithmic intensity scale to visualize multiple diffraction orders with strongly varying intensity. The size of the doughnut-shaped beam profile increases with the topological charge l. Magnified sections for l = −2 to l = 2 for (b) sinusoidal and (c) saw-tooth patterns with linear intensity scale are compared with simulations. (b) The sinusoidal pattern shows good agreement, whereas for (c) a larger deviation is observed. (d) The azimuthally averaged intensities of the measured beams in (b) are plotted against the radial distance from the center of each beam.

