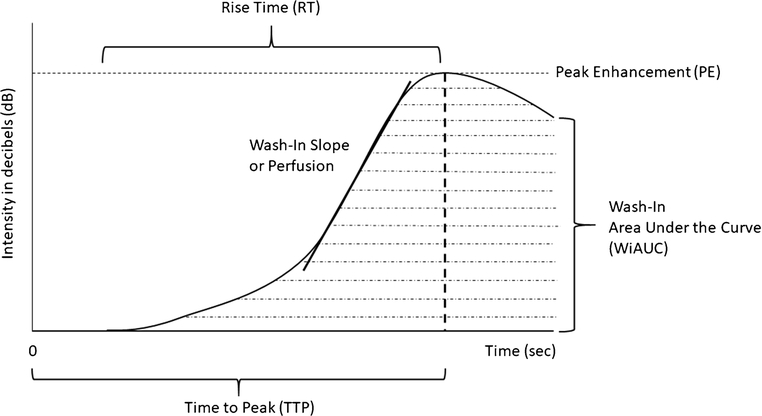
Figure 1. Microbubble Wash-In Time Intensity Curve (TIC).
The graph represents a time intensity curve generated based on the dynamic microbubble wash-in data. Time 0 represents the time of microbubble injection. Peak enhancement (PE) refers to maximum microbubble intensity (in decibels or dB) during the wash-in phase. The time (sec) it takes from injection to reach PE is called time to peak (TTP). The time from the start of curve rise to peak enhancement is called rise time (RT). The area under the TIC is called wash-in area under the curve (WiAUC) and represents microbubble volume. The slope of the wash-in curve is called wash-in slope or perfusion.

