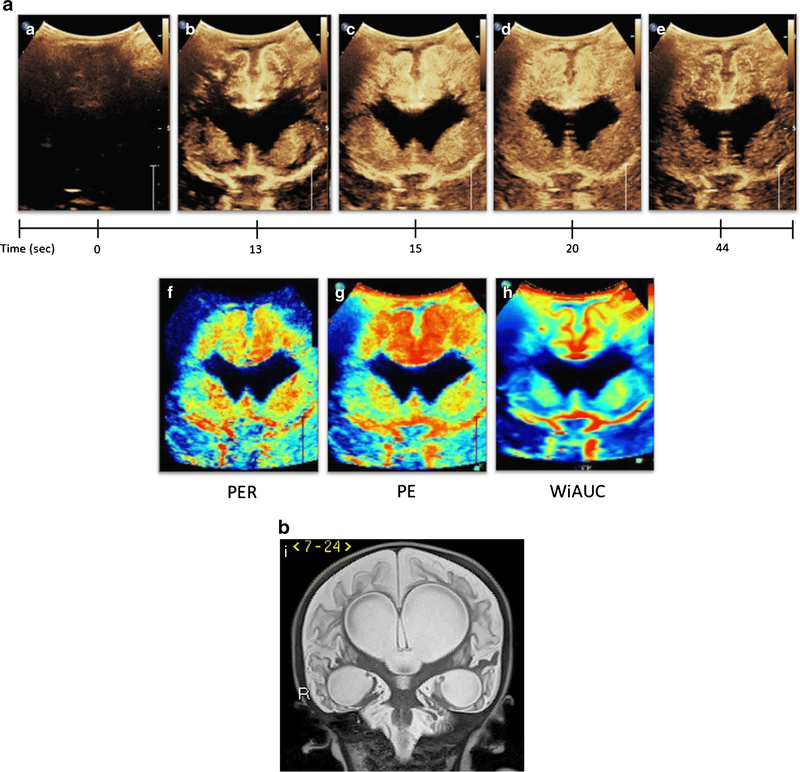
Figure 6. Generation of Ultrasound Perfusion Maps from CEUS-B.
Figure 6a (A-E) depicts CEUS-B of an infant status post multiple cardiac arrests and extracorporeal membrane oxygenation. Dynamic CEUS-B images from time 0 to 44 seconds demonstrate abnormally avid perfusion to the cortical and subcortical regions of the cerebral cortex as well as the central gray nuclei, resulting in abnormal GNC ratio Higher peak intensity and area under the curve, as well as delayed washout was seen in both regions as compared to normal subjects. Figure 6a (F-H) represents ultrasound perfusion maps reconstructed from the original CEUS-B. Black denotes no perfusion, blue low perfusion, yellow/green moderate perfusion, and red high perfusion relative to the remainder of the brain. Figure 6a-F is a map of wash-in or perfusion and shows fast rate of wash-in (red) in the cortical/subcortical regions as well as the central gray nuclei. Figure 6a-G is a map of peak enhancement and shows accentuation of increased flow in the cortical/subcortical regions greater than the central gray nuclei. Figure 6a-H is a map of wash-in area under the curve or WiAUC which similarly demonstrates increased flow in the cortical/subcortical regions and central gray nuclei. Figure 6I is a coronal T2-weighted MR sequence of the same patient 4 months following the shown CEUS-B scan and demonstrates interval development of marked encephalomalacia and ventriculomegaly due to the severe hypoxic ischemic injury. This figure is adapted from Shin et al.[27] with permission. Note that Figure 6(A-E) was obtained with EPIQ scanner (Phillips Healthcare, Bothell, WA) and C9–2 transducer with settings of 7 Hz and MI of 0.06.

