Figure 8.

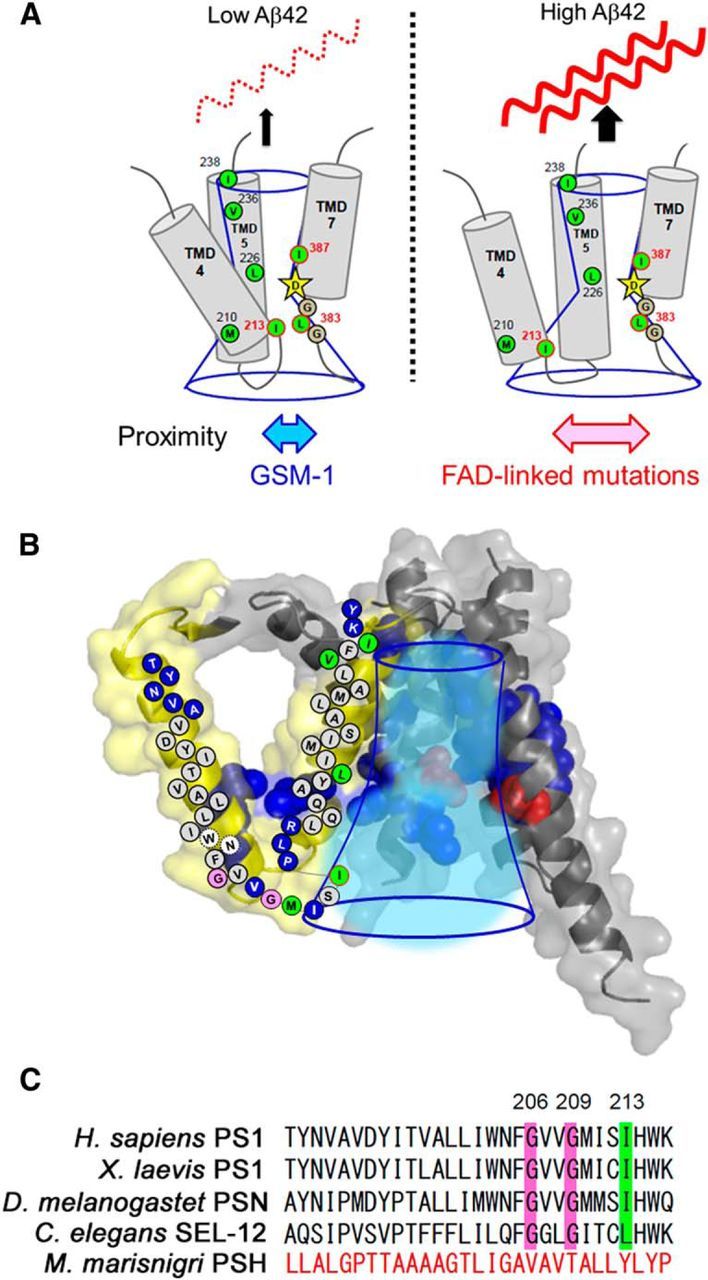
Structure and function of TMD4 and TMD5 of PS1. A, Summary of SCAM analyses and cross-linking experiments. The cytosolic residues of TMD4, TMD5, and L383, which face the catalytic pore, are shown as green circles. Catalytic aspartate on TMD7 is shown by stars. Conserved glycines in the catalytic motif are denoted as gray circles. GSM-1 treatment reduced the Aβ42 production and the distance between I213 and L383 in the catalytic site (left). In contrast, FAD-linked mutation increased the Aβ42 levels and the distance (right), suggesting that the proximity between the cytosolic sides of TMD4 and TMD7 correlates with Aβ42-generating activity. B, Schematic diagram of TMD4 and TMD5 (shown in yellow) in the PS1 model (Li et al., 2013). Residues facing the hydrophilic environment are shown as blue spheres and circles. Catalytic aspartates are shown as red spheres. Conserved glycines and the residues involved in the binding with l-685,458 are shown as pink and green circles, respectively. The catalytic pore is indicated by blue lines. C, Alignment of primary sequences of PS1 or its homolog TMD4 of Homo sapiens, Xenopus laevis, Drosophila melanogaster, Caenorhabditis elegans, and M. marisnigri. Positions of conserved glycines and isoleucine are indicated in pink and green, respectively.
