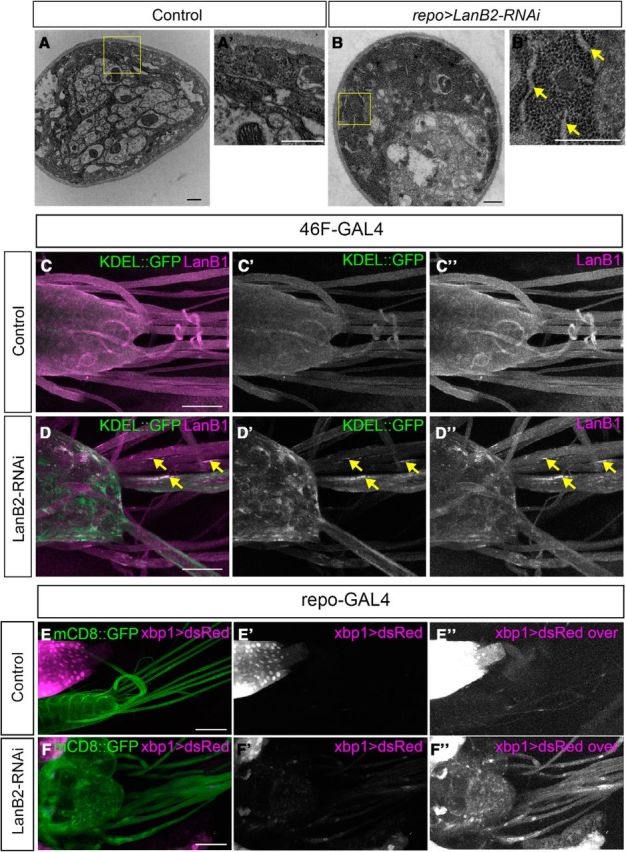
Figure 3.

Loss of LanB2 leads to increased ER, LanB1 aggregates, and ER stress. A, B, TEM images of peripheral nerve section. A, Control nerves show the normal distribution of ribosomes in perineurial glia. B, repo>LanB2-RNAi-generated swollen perineurial glia with increased density of ribosomes and areas of distended ER. Yellow boxes are shown digitally magnified in A′ and B′ and yellow arrows point to areas of distended ER. Scale bars, 500 nm. C, D, The ventral nerve cord and peripheral nerves of larvae where the perineurial glia ER was labeled using 46F>KDEL::GFP (green) and immunolabeled with anti-LanB1 antibody (magenta). C, Distribution of KDEL::GFP and LanB1 is uniform and diffuse in control nerves. D, Colocalization of LanB1 accumulations and ER aggregates was observed in 46F>LanB2-RNAi (yellow arrows). Scale bars, 50 μm. E, F, Ventral nerve cord and peripheral nerves were labeled using repo>mCD8::GFP and xbp1 expression was visualized using the xbp1>dsRed expression reporter. Control, repo-GAL4 (E) had weak levels of dsRed in the glia while repo>LanB2-RNAi (F) showed increased dsRed expression. The red channel was overexposed equally in E″ and F″ to show differences in xbp1 expression. Scale bars, 100 μm.
