Figure 7.

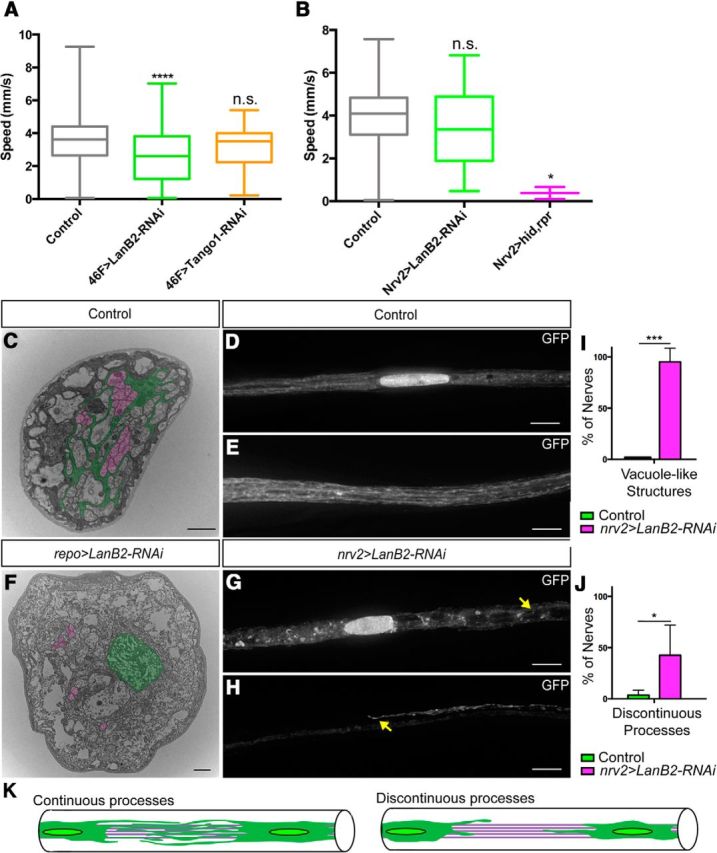
Effects of LanB2 knockdown on perineurial and wrapping glia. A, Average instantaneous larval speed of control (46F-GAL4, gray) and 46F>RNAi lines. Larval speeds were as follows: control, 3.73 ± 1.79 mm/s, n = 116; 46F>LanB2-RNAi, 2.60 ± 1.65 mm/s, n = 58); 46F>Tango1-RNAi, 3.13 ± 1.40 mm/s, n = 22. Knockdown of Tango1 (p = 0.281) did not significantly affect speed. Knockdown of LanB2 resulted in significantly slower larvae (p = 0.0002). For each box-and-whisker plot, the box represents the first and third percentiles, the middle line the median, and the whiskers are the minimum and maximum. B, Average instantaneous larval speed of control (nrv2-GAL4), nrv2>LanB2-RNAi, and nrv2>hid,rpr lines. There was no significant difference between controls (3.87 ± 1.64 mm/s, n = 74) and nrv2>LanB2-RNAi (3.42 ± 1.78 mm/s, n = 50, p = 0.310). There was a significant difference between controls and nrv2>hid,rpr (0.38 ± 0.40 mm/s, n = 2, p = 0.013). C, F, TEM of peripheral nerve sections from control repo-GAL4 and repo>LanB2-RNAi nerves. Wrapping glia were false-colored green and a selection of axons were false-colored magenta. Control wrapping glia extended processes around axons (C), while wrapping glia in repo>LanB2-RNAi nerves did not (F). Scale bars, 1 μm. D, E, Projection images of control peripheral nerves with nrv2-GAL4 driving GFP expression in wrapping glia near nuclei (D) and between nuclei (E) demonstrate the extensive wrapping glial processes within the core of the nerve. Scale bars, 15 μm. G, H, Projection images of peripheral nerves in nrv2>LanB2-RNAi larvae near a nucleus (G) and between nuclei (H) demonstrate vacuole-like structures (G, arrow) and discontinuous processes (H, arrow) that illustrate the failure of neighboring wrapping glia to connect and ensheath the peripheral axons. Scale bars, 15 μm. I, Quantification of the wrapping glial morphological defects in control nrv2-GAL4 versus nrv2>LanB2-RNAi nerves. Control nerves (n = 55) had significantly less vacuole-like structures compared with nrv2>LanB2-RNAi nerves (n = 47, p < 0.001). J, Control nerves had no evidence of discontinuous processes (n = 47), while a significantly higher percentage of nrv2>LanB2-RNAi nerves did (n = 21, p < 0.001). Error bars are SD. K, Diagram depicting continuous processes in control nerves seen by overlapping glial processes (green) between two wrapping glial nuclei (green circle) covering axons (gray). Discontinuous processes are defined as glial processes that do not overlap between two wrapping glial nuclei.
