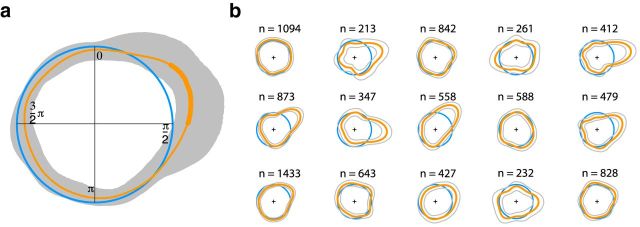
Figure 2.
a, Deviation from null hypothesis of uniformly distributed microsaccades in the interval between two R peaks. Shown is a comparison of circular density of R-peak-locked microsaccades (orange; 95% confidence interval in gray) and circular density of a uniform distribution (blue). b, Circular densities of relative microsaccade onsets for each individual observer (orange), along with the 95% confidence interval (gray). Computation is based on resampling from the original pool of microsaccades of a given participant. In addition, the number of microsaccades for each observer is presented on top of the circular densities.

