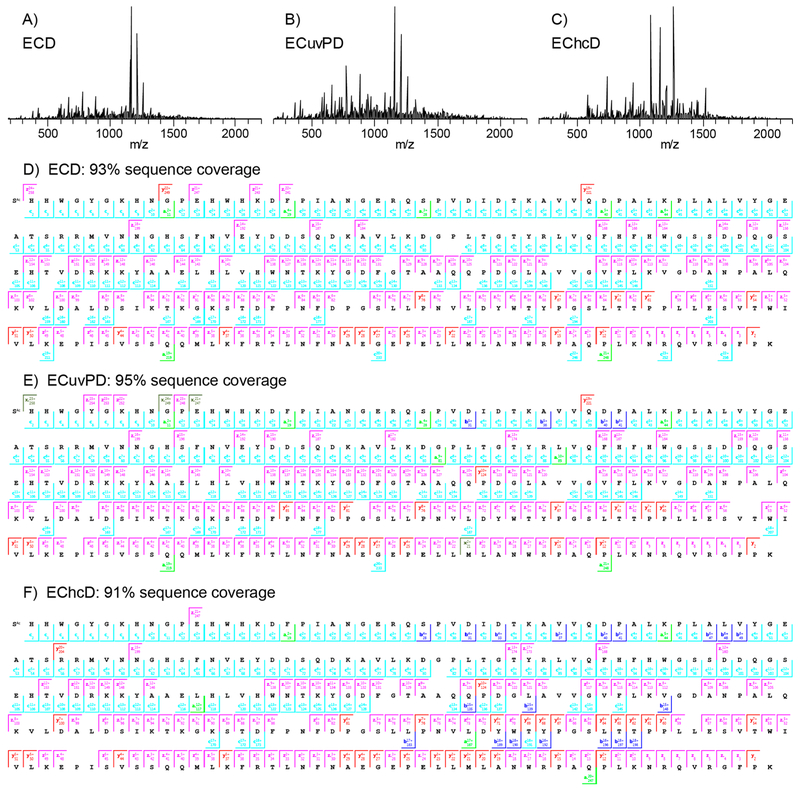
Figure 6.
ECD (A), ECuvPD (B), and EChcD (C) spectra of the 25+ charge state of bovine carbonic anhydrase II and the corresponding product ion maps for ECD (D), ECuvPD (E), and EChcD (F). Spectra were acquired with a resolving power of 240 000 at m/z 200 and are the average of 500 microscans. ECuvPD was performed with one 0.5 mJ laser pulse per acquisition, and EChcD was performed with a collision energy of 12 eV.

