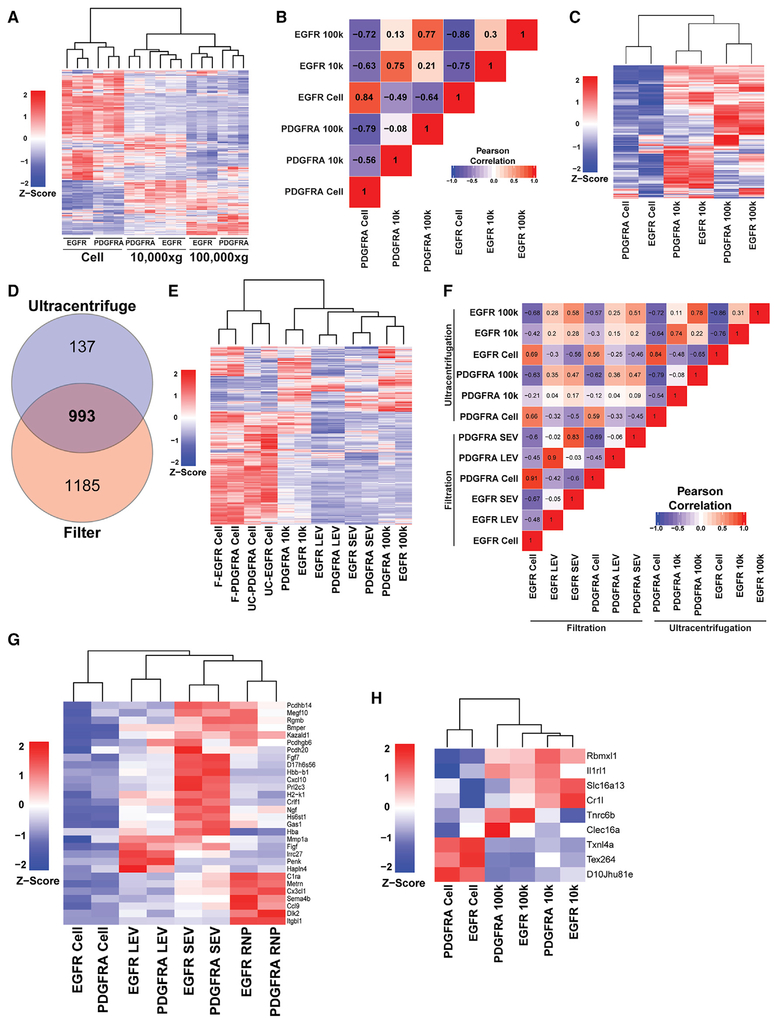
Figure 3. exPTNs from Ultracentrifugation EVs Overlap with SEVs.
(A) Unsupervised hierarchical clustering analysis of the z-score proportional protein expression values of 1,130 proteins identified in cells, 10,000 × g and 100,000 × g protein fractions. MS spectral count values were Z score normalized prior to cluster analysis.
(B) Pearson correlation coefficients of a pairwise analysis of expression levels between cellular, 10,000 ×g and 100,000 × g protein levels from the EGFR and PDGFRA GBM cell cultures. The values of the coefficient are indicated and are marked with background colors. Pearson correlation coefficients > 0.91 and < −0.91 are significant (p < 0.05) and correlation coefficients > 0.7 and < −0.7 are trend suggestive.
(C) Unsupervised hierarchical clustering analysis of Z score protein expression values for UC-enriched proteins. A combined dataset of 407 proteins significantly enriched over cellular fraction was derived from each UC fraction from the 1,130 dataset to create the heatmap.
(D) Venn diagram of unique and common proteins identified in filtered and UC EVs isolated from conditioned medium from EGFR and PDGFRA GBM cells. Data represent three independent biological replicates.
(E) Unsupervised hierarchical clustering analysis of Z score mean protein expression values for vesicle enriched proteins from filter and UC-enriched proteins. The combined dataset of 993 proteins from (D) was used create the heatmap.
(F) Pearson correlation coefficients of a pairwise analysis of expression levels of the 993 proteins shared between cellular, LEV, SEV, and 10,000 × g and 100,000 × g from the EGFR and PDGFRA GBM cell cultures. The values of the coefficient are indicated and are marked with background colors. Pearson correlation coefficients > 0.91 and < −0.91 are significant (p < 0.05), and correlation coefficients > 0.7 and < −0.7 are trend suggestive.
(G) Unsupervised clustering of 30 proteins, displayed on a vesicle-type basis, extracted from the 181 EV expressed proteins not previously described in Vesiclepedia or NCI-60 vesicle proteomic datasets.
(H) Unsupervised clustering of the 9 UC-unique proteins, displayed on a UC fraction-type basis.
See also Figure S3.

