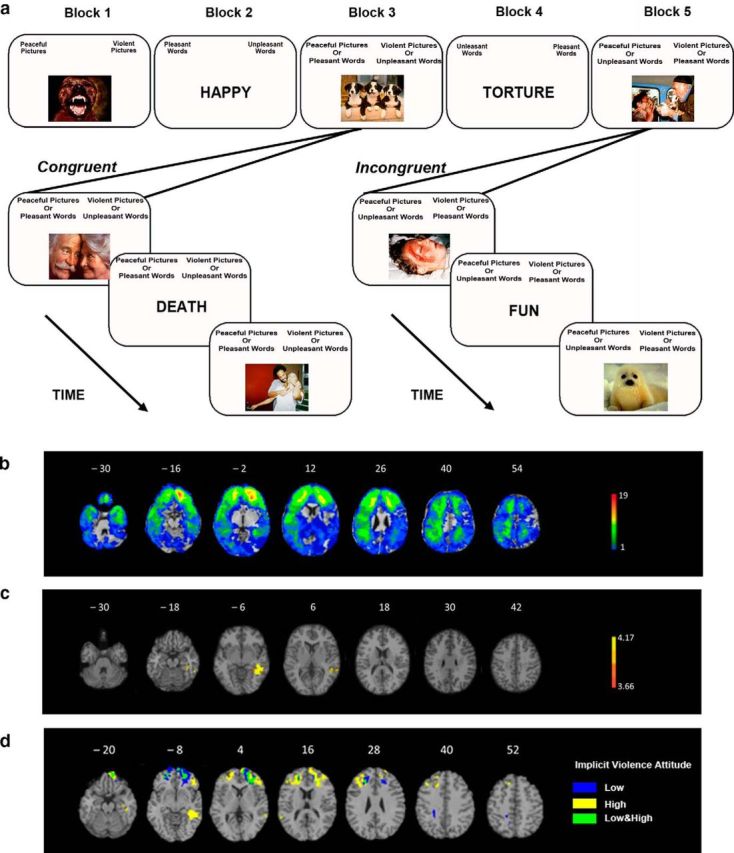
Figure 1.

Violence IAT design (a) and lesion analysis results (b–d). a, Violence IAT design. Participants completed five blocks, including one congruent and one incongruent condition. b, Lesion overlay of all 112 patients with focal penetrating traumatic brain injuries. The color indicates the number of patients with damage to a given voxel. The greatest lesion overlap is in red and the least lesion overlap is in blue. c, VLSM of violence IAT performance (D-score). Lesions within the left inferior posterior temporal cortex were associated with lower D-scores (i.e., more positive implicit attitude toward violence) on the violence IAT. The statistical map is corrected at 5% FDR, with minimum cluster size of 10 voxels. The color indicates the z-value: yellow represents the highest z-value and orange represents the lowest z-value. d, Conjunction and disjunction lesion overlay of the Violence IAT low and high score groups. Blue indicates regions associated with high D-score only (i.e., a less positive implicit attitude toward violence), yellow indicates regions associated with low D-score only (i.e., a more positive implicit attitude toward violence), and green indicates regions associated with both high and low D-score (i.e., overlapping regions of more and less positive implicit attitude toward violence). Patients with lower D-score (i.e., a more positive implicit attitude toward violence) sustained lesions that affected the left inferior posterior temporal cortex and bilateral dlPFC, whereas patients with higher D-scores (i.e., a less positive implicit attitude toward violence) had more lesions in the middle and superior orbitofrontal cortex. Only voxels with a minimum of four patients are displayed. All brain figures are in radiologic convention: the right hemisphere is on the reader's left.
