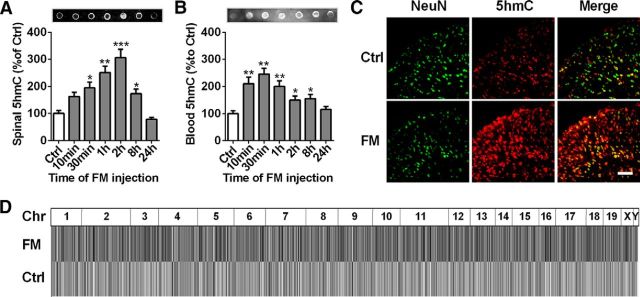
Figure 1.
Genomic 5hmC analysis in spinal cord or blood in a formalin-induced acute inflammation pain model. A, B, Time course of dot blot assay of spinal 5hmC (A) or blood 5hmC (B) in formalin (FM)-induced acute inflammatory pain mice. Spinal or blood DNA samples were collected from 10 min to 24 h after FM injection and then dot-blotted using a 5hmC-specific antibody. *p < 0.05 versus control (Ctrl) group, **p < 0.01 versus control group, ***p < 0.001, versus control group; n = 6. C, Combined 5hmC (red) and NeuN (a neuronal marker; green) immunofluorescence staining in spinal cord at 2 h after formalin or saline (Sal) injection. Scale bar, 25 μm. D, Genomic 5hmC profiles in formalin-induced acute inflammatory pain. The read densities of each chromosome (Chr) in heatmap have been equally scaled and then normalized through the total number of mapped reads per sample.

