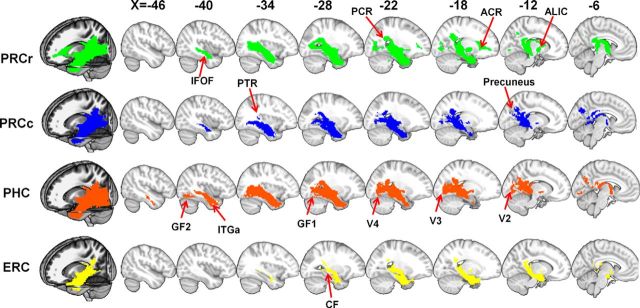
Figure 6.
Population maps of the probabilistic tractography results for each subregion from the left hemisphere. Population maps of the probabilistic tractography results from the left PRCr (green), PRCc (blue), PHC (orange), and ERC (yellow) are shown on the ICBM152 template in MNI space with MRIcron. The numbers in the top row number are the sagittal slice numbers from the MNI152 template.

