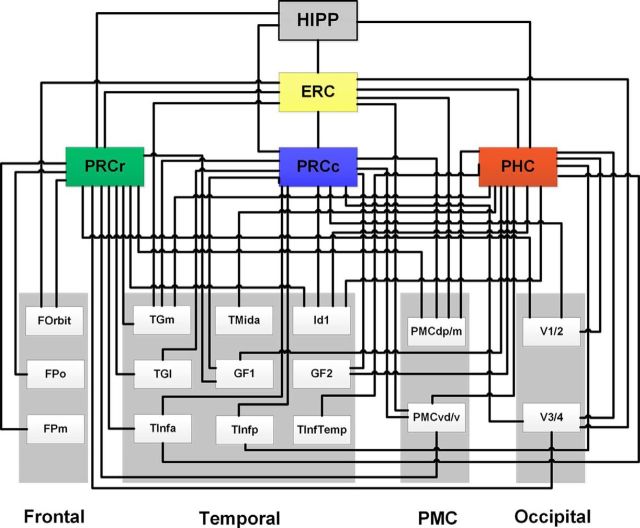
Figure 8.
Summary of the probabilistic tractography results for each PHR subregion. The wiring diagram illustrates the probabilistic tractography organization for all subregions. These results are integrated in Figures 6 and 7. The target brain regions were obtained from the Dusseldor–Julich, Brainnetome, and Harvard–Oxford atlases (for details, see Table 1).

