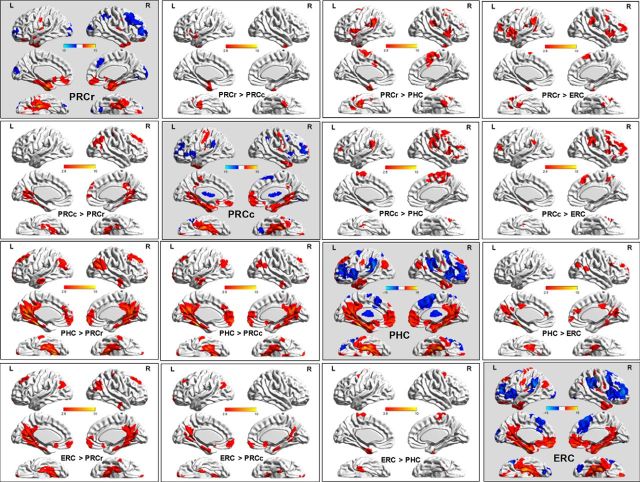
Figure 9.
Functional connectivity pattern for each left PHR subregion and each left subregional RSFC variations. Shown are spatial distribution and paired difference maps of the RSFC patterns for the left PHR subregions. Statistical parametric maps are displayed using a statistic thresholded at p (uncorrected) <0.005 and cluster extent k > 67 voxels (536 mm3) was used to achieve a corrected statistical significance of p < 0.01, as determined by AlphaSim correction. The RSFC and the relevant connection differences maps are projected onto a 3D brain surface with intensity scales representing the T-values.

