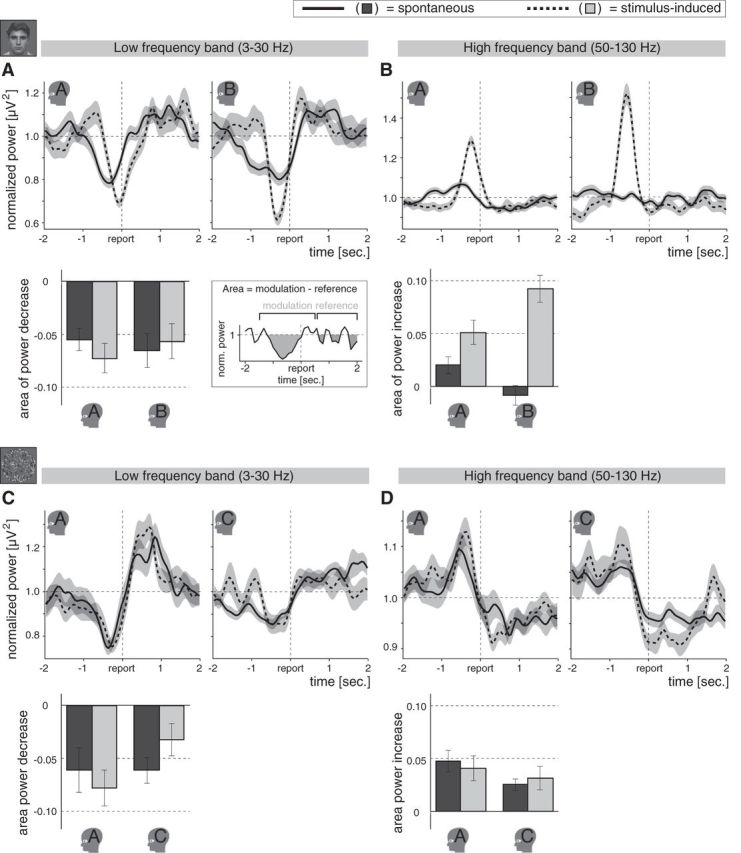
Figure 4.

Spectral perturbations for individual participants. A, Top, Spectral perturbations for the low-frequency band of interest (3–30 Hz) in the binocular rivalry experiment, averaged across epochs for Participants A and B separately (presented on the left and right, respectively). Each line on average represents 56 epochs. The perturbations are time-locked to the moment a spontaneous (solid lines) or stimulus-induced (dashed lines) change was reported (indicated as “report” on the time axis). Spontaneous as well as stimulus-induced perceptual changes were associated with an occipital low-frequency power decrease, even though the stimulus was changed in the latter, but not in the former. Shading indicates ±SEM across epochs. Bottom, Area of the low-frequency power decrease for the individual participants of the binocular rivalry experiment (±SEM across epochs; see schematic illustration on the right). Whereas the perturbations may be influenced by jitter in reaction times, the areas are insensitive to such jitter. Spontaneous (dark gray bars) and stimulus-induced (light gray bars) changes were associated with a similar drop in low-frequency power. Miniatures of the stimuli indicate the respective experiments. Small head icons indicate participants. B, Top, Spectral perturbations for the high-frequency band of interest (50–130 Hz) in the binocular rivalry experiment, averaged across epochs (on average 56 epochs per line) for Participants A and B separately (presented on the left and right, respectively). Preceding the report there was an increase in high-frequency power for stimulus-induced changes that was less clear for spontaneous changes. Bottom, Areas of the high-frequency power increases for the individual participants of the binocular rivalry experiment. The high-frequency power increase was smaller for the spontaneous than for the stimulus-induced changes. Details as in A. C, Top, Spectral perturbations for the low-frequency band of interest in the 3D-motion rivalry experiment, averaged across epochs (on average 34 epochs per line) for Participants A and C separately (presented on the left and right, respectively). As in the binocular rivalry experiment (A), spontaneous as well as stimulus-induced changes elicited a decrease in low-frequency power. Bottom, Area of the low-frequency power decrease for the individual participants of the 3D-motion rivalry experiment, showing that the drop in low-frequency power was similar in magnitude for spontaneous and stimulus-induced changes. Details as in A. D, Top, Spectral perturbations for the high-frequency band of interest in the 3D-motion rivalry experiment, averaged across epochs (on average 34 epochs per line) for Participants A and C separately (presented on the left and right, respectively). Spontaneous and stimulus-induced changes were associated with a similar high-frequency power increase in the 3D-motion rivalry experiment, whereas in the binocular rivalry experiment (B) the increase was smaller for spontaneous than for stimulus-induced changes. Bottom, Area of the high-frequency power increase for the individual participants of the 3D-motion rivalry experiment. Spontaneous and stimulus-induced changes were associated with a similar high-frequency power increase. Details as in A.
