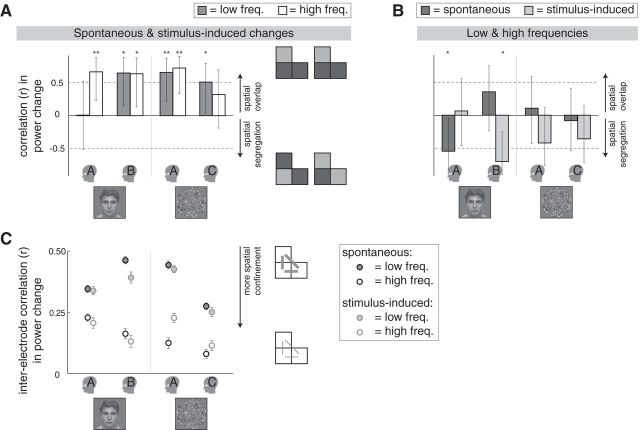
Figure 6.
Measures of similarity in spatial organization. A, The spatial correlation between spontaneous and stimulus-induced changes, presented for the individual participants. Positive correlation coefficients indicate that the pattern of activity across electrodes was similar (colocalized) for spontaneous and stimulus-induced changes (see schematic illustration on the right; icons symbolize activations of three neighboring electrodes). Specifically, the values (r ± 95% CI) represent the correlation in the areas of the modulations per electrode. Miniatures of the stimuli indicate the respective experiments. Small head icons indicate the participants. **p < 0.01; *p < 0.05. Freq., Frequencies. B, The spatial correlation between the low-frequency and high-frequency modulations, presented for the individual participants. A negative correlation coefficient indicates that electrodes with a large high-frequency modulation tended to have a small low-frequency modulation (correlation between high-frequency power increase as measured and low-frequency power decrease multiplied by −1). Details as in A. C, Interelectrode correlations for the low-frequency (filled circles) and high-frequency (open circles) modulation, presented for the individual participants. For spontaneous (circles with black edges) as well as the stimulus-induced (circles with gray edges) changes, the correlations were stronger in the low-frequency than in the high-frequency modulation, suggesting that for both types of changes the high-frequency modulation reflected more spatially confined activity than the low-frequency modulation. Specifically, the average correlation coefficients are presented (mean r ± SEM) of the correlations between all possible occipital electrode pairs regarding the areas of the modulations per epoch, as schematically illustrated by the icons on the right (gray lines symbolize correlations between pairs of electrodes).

