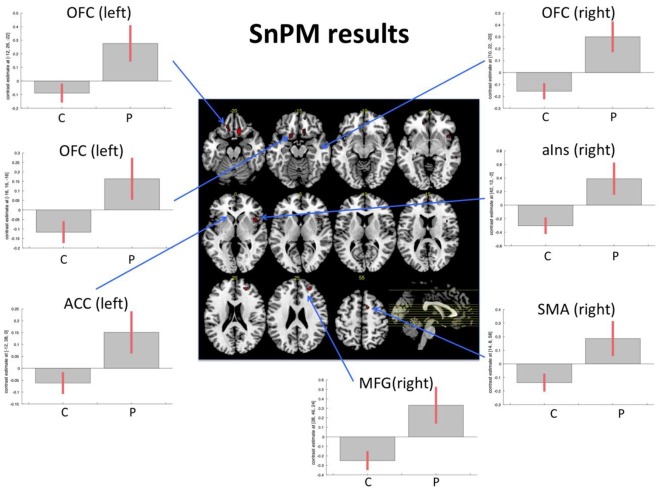
Figure 1.
Functional magnetic resonance imaging (fMRI) task. Figure displays the results from the non-parametric analysis on the pre-post differences. The results highlighted areas where patients (P) demonstrated an increase of activity from pre- to post-examination, while control subjects (C; irrespective of music intervention) did not show an increase or even a slight decrease. The results are explored with a non-parametric p-value of p < 0.001. Bar plots show contrast estimates (with 90% confidence interval). OFC, orbitofrontal cortex; MFG, middle frontal gyrus; aIns, anterior insula; ACC, anterior cingulate cortex; SMA, supplementary motor area.

