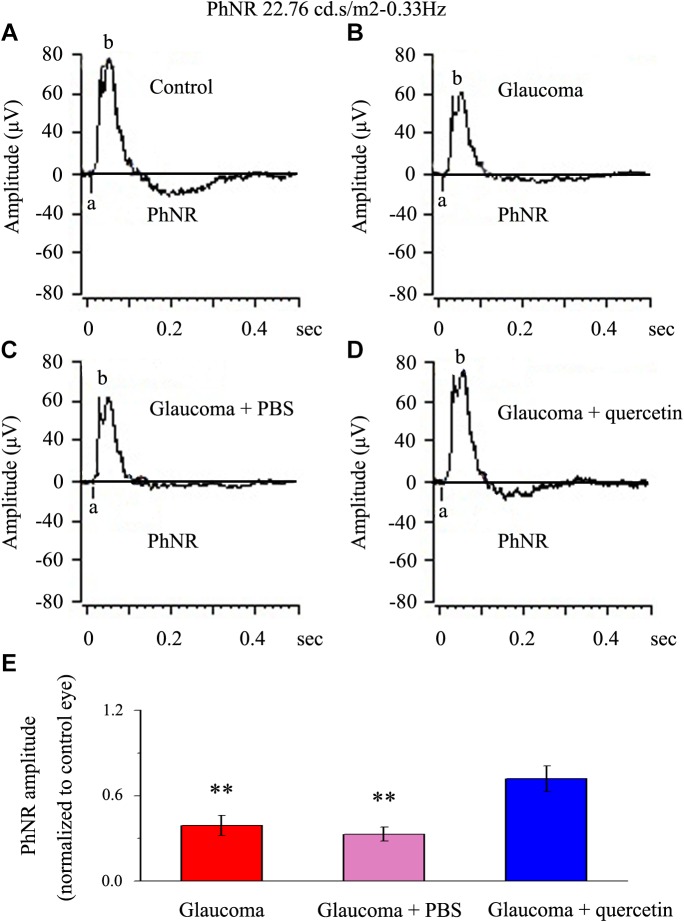
FIGURE 1.
PhNR of normal and glaucomatous rat eyes. (A,B) Representative traces of the “a” wave, the “b” wave, and PhNR in a control eye (A) and a glaucomatous eye (B) in step 3 with the stimulus applied at 22.76 cd.s/m2–0.33 Hz. (C,D) Representative waves in a PBS-treated glaucomatous eye (C) and quercetin-treated glaucomatous eye (D) in the same step and with the same stimulus used in (A,B). (E) Quantitative analysis of PhNR amplitude (n = 12). The amplitude was normalized to the amplitude in control retinas. ∗∗p < 0.01 (one-way analysis of variance). a, “a” wave; b, “b” wave; PhNR, photopic negative response.

