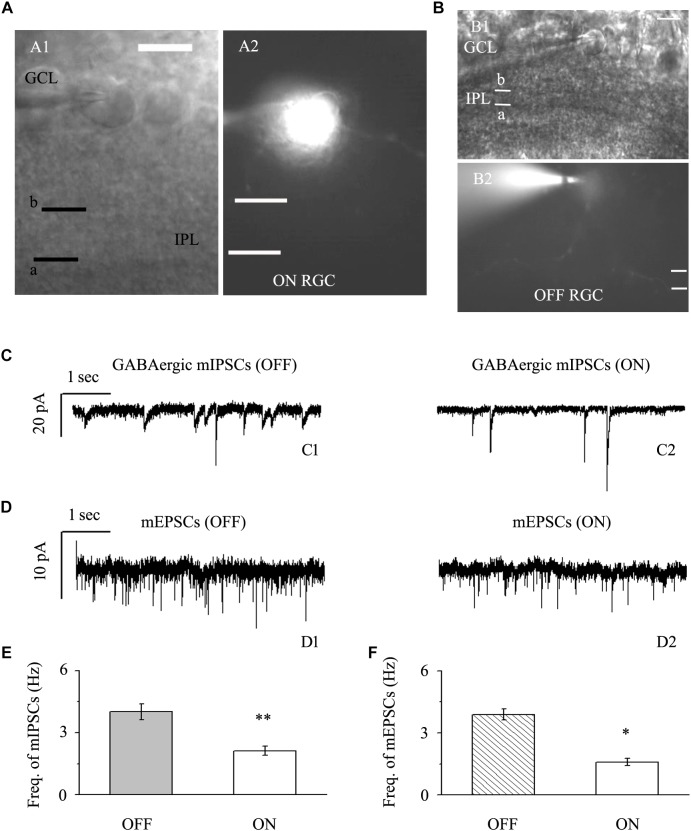
FIGURE 2.
Baseline sIPSCs and sEPSCs were more common in OFF-type RGCs than in ON-type RGCs. (A,B) The infrared interference phase microscope image in (A) shows all of the retinal layers. Representative Lucifer Yellow-filled OFF-type RGCs with dendritic arborizations in the distal (b) parts of the IPL are shown (A1, A2). Representative Lucifer Yellow-filled OFF-type RGCs with dendritic arborizations in the proximal (a) and distal (b) parts of the IPL are also shown (B1, B2). GCL, ganglion cell layer; IPL, inner plexiform layer. Scale bar, 5 μm. (C) Representative traces showing the frequency of GABAergic mIPSCs in both OFF-type RGCs (C1) and ON-type RGCs (C2). Vertical scale bar, 20 pA; horizontal scale bar, 1 s. (D) Representative traces showing the frequency of glutamatergic sEPSCs in both OFF-type RGCs (D1) and ON-type RGCs (D2). Vertical scale bar, 10 pA; horizontal scale bar, 1 s. (E) Summarized data from 14 RGCs showing that baseline mIPSCs were more common in OFF-type RGCs than in ON-type RGCs. (F) Summarized data from 12 RGCs showing that baseline mEPSCs were more common in OFF-type RGCs than in ON-type RGCs. ∗p < 0.05 and ∗∗p < 0.01, unpaired Student’s t-test.

