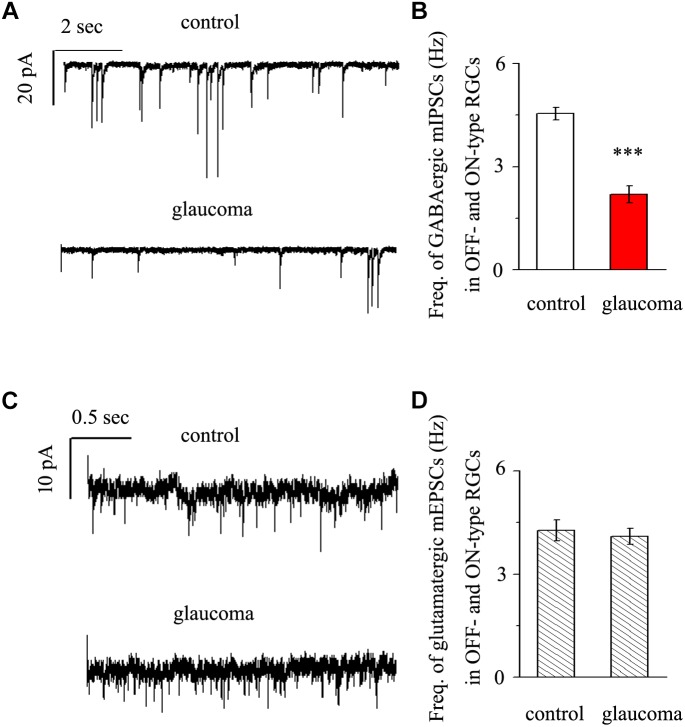
FIGURE 3.
Effects of chronic glaucoma on retinal mIPSCs and mEPSCs. (A) Representative traces of voltage clamp recordings of GABAergic mIPSCs in the presence of TTX (1 μM) in control and glaucomatous retinas. The baseline frequency of mIPSCs was markedly lower in glaucomatous retinas than in control retinas. Vertical scale bar, 20 pA; horizontal scale bar, 2 s. (B) Bar graphs showing the mean frequency of mIPSCs in control and glaucomatous retinas. (C) Representative traces of voltage-clamp recordings of glutamatergic mEPSCs in the presence of TTX (1 μM) in control and glaucomatous retinas. The baseline frequency of mEPSCs did not differ between glaucomatous retinas and control retinas. Vertical scale bar, 10 pA; horizontal scale bar, 0.5 s. (D) Bar graphs showing the mean frequency of mEPSCs in control and glaucomatous retinas. ∗∗∗p < 0.001, unpaired Student’s t-test.

