Figure 1.

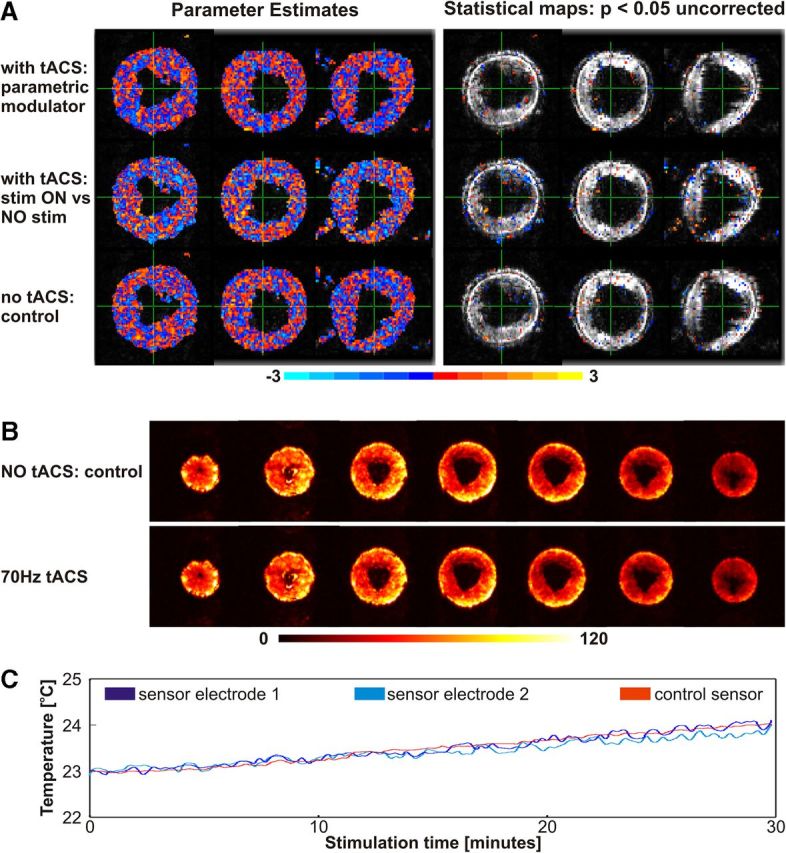
Quality and safety tests. A, Quality tests performed with a watermelon. Parameter estimates (left) and statistical maps (right) thresholded at p = 0.05 uncorrected for the parametric analysis (upper row; parametric modulator: regressor values were set to 6, 10, 20, 40, 60, and 80 for the blocks where the stimulation frequency was 6, 10, 20, 40, 60, and 80 Hz respectively, and 0 for the baseline blocks with no stimulation), for stimulation ON versus OFF (middle row; regressor contrast weights were set to 1 for all stimulation blocks, regardless of the stimulation frequency, and 0 for baseline) and for the control analysis (bottom row; same regressor contrast weights as for the stimulation ON versus OFF analysis, but for the control fMRI dataset, where the electrodes were attached to the melon and connected to the stimulator, but with the stimulator switched off). B, SfNR images for two conditions: during 70 Hz tACS stimulation and during the control condition, where the electrodes were attached to the melon and connected to the stimulator, but with the stimulator switched off. Low SfNR values indicate a high temporal variability of the EPI signal, hinting toward an undesired impact of the tACS stimulation on the EPI quality. Here no additional temporal EPI signal fluctuation was induced by the tACS stimulation compared with the control measurement. A comparable SfNR map was observed for 20 Hz tACS. C, Temperature measurement during 70 Hz tACS: the temperature under the active electrodes increased with <1°C over the 30 min stimulation. Critically, there was no difference in the temperature increase under the active electrodes and the increase in temperature in the control sensor, which was ≥6 cm away from any of the two active electrodes. Similar temperature increases were observed also during 20 Hz tACS.
