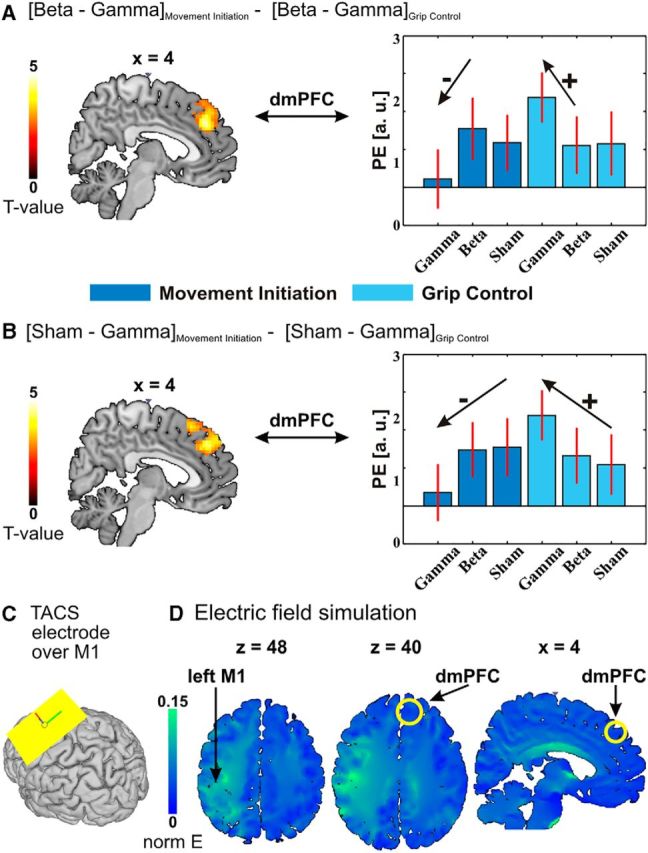
Figure 5.

A, Interaction between motor task (movement initiation versus grip control) and tACS frequency (beta tACS vs gamma tACS). B, Interaction between motor task (movement initiation vs grip control) and tACS condition (sham stimulation vs gamma tACS). The left panels of A and B show thresholded (p < 0.05 FWE cluster corrected, cluster-forming threshold T(19) > 2.6) SPMs projected onto sagittal brain slices in MNI space, whereas the right panels illustrate the effects with parameter estimates (PE; proportional to BOLD signal changes) extracted from the dmPFC region activated by the interaction contrasts. The error bars represent +/−SEM across subjects. C, The position of the tACS electrode (size, 5 × 7 cm; area, 35 cm2) over left M1 used for the main experiment and for the electric field simulation. The other electrode (size, 10 × 10 cm; area, 100 cm2) was placed over the left shoulder. D, The normalized predicted electric field distribution projected onto MNI space is minimal in the dmPFC region that exhibits a significant interaction between motor tasks (movement initiation vs grip control) and tACS frequency (beta tACS vs gamma tACS). The yellow circles indicate the position of the dmPFC region. The electric field is strongest under and in the vicinity of the active electrode placed over left M1 (left and middle transversal views), while the electric field is minimal in the dmPFC region (middle transversal and right sagittal views). The yellow circle in the middle transversal view is centered on the maximum activation in the dmPFC [peak coordinates (MNI): x = 15, y = 32, z = 40; Table 2]. The right sagittal view is the same sagittal view as in A. This projection consolidates the notion that the dmPFC effects are not directly triggered by the stimulation but instead reflect compensatory modulations in response to tACS over M1.
