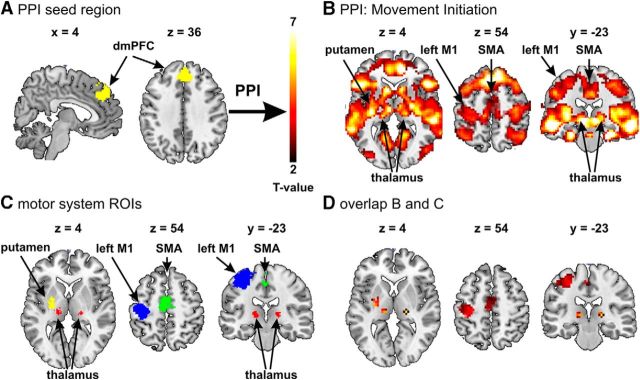
Figure 6.
Task-dependent changes in the functional coupling between the dmPFC seed region and other brain areas, assessed using PPI analysis. A, dmPFC seed region for the PPI analysis generated as the overlay of the two interactions shown in Figure 5A, B. B, Brain areas that exhibit increased functional coupling with the seed region during movement initiation (p < 0.05 FWE cluster corrected, cluster-forming threshold T(19) > 2.6). C, Standard motor system regions of interest [ROIs; left M1, supplementary motor area (SMA), thalamus, and left putamen] generated by a meta-analysis of 303 motor studies (Neurosynth database dated Jan. 21, 2015; http://neurosynth.org/). To generate these ROIs, the standard motor network activation map was first corrected for multiple comparisons using an expected false discovery rate of 0.01, while the height of the threshold was set to T > 6.5 for generating the left M1 and SMA ROIs and to T > 5 for generating the putamen and thalamus ROIs. We used different thresholds for different ROIs to be able to distinguish the ROIs from neighboring brain areas (e.g., left M1 from left dorsal premotor area). D, Overlay between the standard motor system ROIs shown in C and the PPI analysis shown in B.

