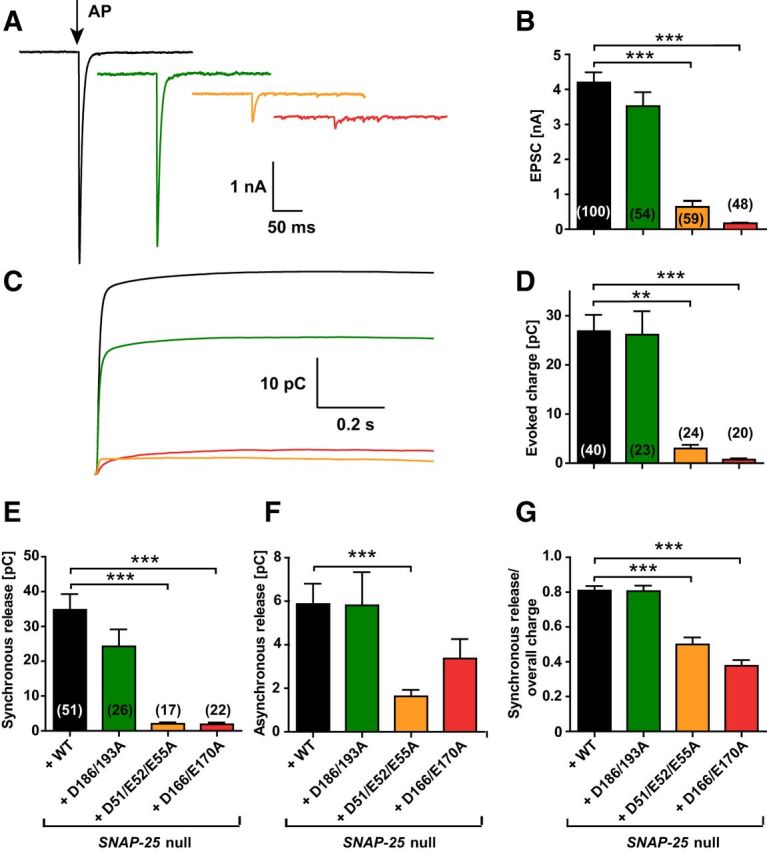
Figure 3.

The extent and synchronicity of evoked release is affected by D166/E170A and D51/E52/E55A mutations in SNAP-25B. A, A 2 ms depolarization to 0 mV of the autaptic hippocampal neuron (indicated by arrow) leads to an EPSC (representative traces). B, Peak EPSC amplitudes were strongly reduced in the D166/E170A and D51/E52/E55A mutants. C, Cumulative charge of EPSCs. D, Total evoked charge (1 s integration) after a single depolarization. E, Synchronous release component of EPSCs. F, Asynchronous release component of EPSCs. G, Fractional contribution of the synchronous release component to overall release. Bar graphs display mean ± SEM. **p < 0.01; ***p < 0.001 (Kruskal–Wallis test followed by Dunn's post test).
