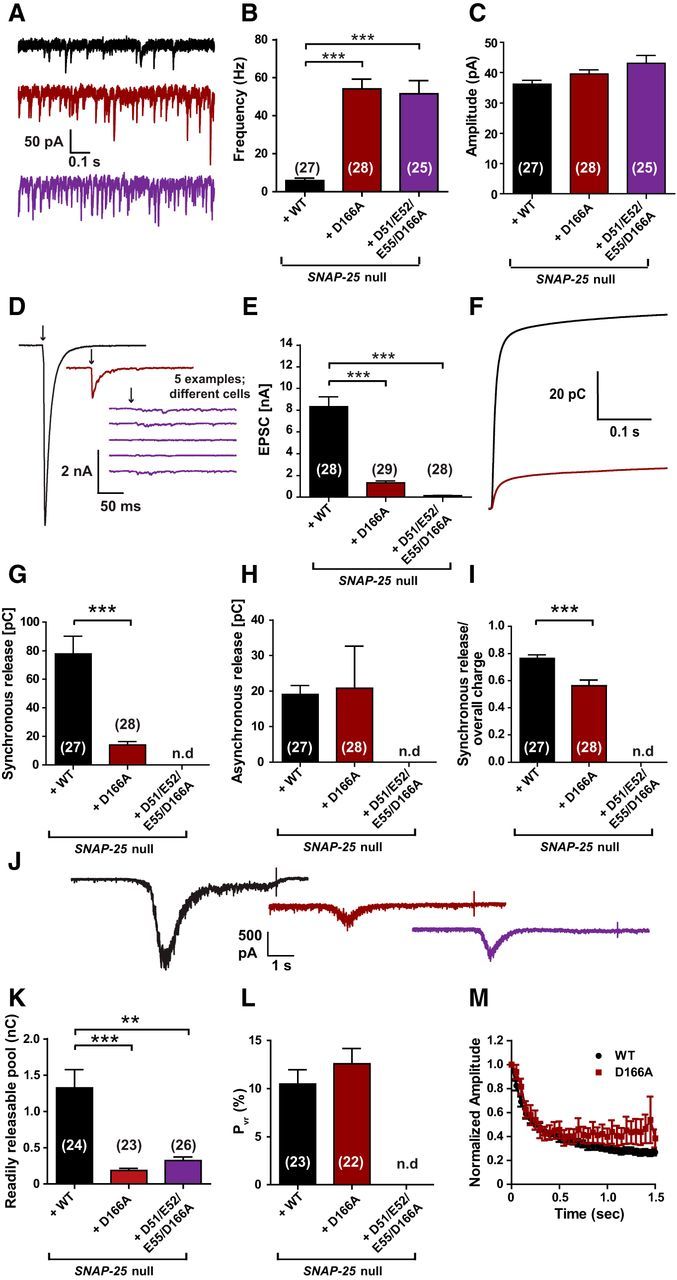
Figure 9.

The D166A mutant unclamps spontaneous release and inhibits vesicle priming. A, Example traces of spontaneous vesicle release at a holding potential of −70 mV. B, Spontaneous release frequencies were strongly increased by SNAP-25B D166A or SNAP-25B D51/E52/E55/D166A. C, Amplitudes of spontaneous events were not significantly changed. D, Representative traces of single stimulations (indicated by arrows). Five examples are shown for the D51/E52/E55/D166A mutant, which did not have detectable evoked release. E, Peak EPSC amplitudes were reduced in the D166A mutant and absent in the D51/E52/E55/D166A mutant. Note that, in this set of experiments, EPSC amplitudes were higher than in previous experiments (Fig. 3), but the release probability was similar (L and cf. Fig. 4G). F, Cumulative charge of EPSCs used for kinetic analysis. The D51/E52/E55/D166A mutant could not be analyzed. G, H, D166A mutation reduced the synchronous release, but did not affect asynchronous release. I, Therefore, the ratio of synchronous release was decreased. J, Representative traces of hypertonic shock (500 mOsm sucrose) to measure the readily releasable pool. K, RRPs were decreased in both mutants. L, Release probability was not affected by the D166A mutation. M, Train of stimulations at 20 Hz gave similar short-term plasticity for WT and the D166A mutant. Bar and line graphs display mean ± SEM. *p < 0.05, **p < 0.01, ***p < 0.001 (Kruskal–Wallis test, followed by Dunn's post test for B, C, E, and K; unpaired t test for G–I and L). n.d., Not determined.
