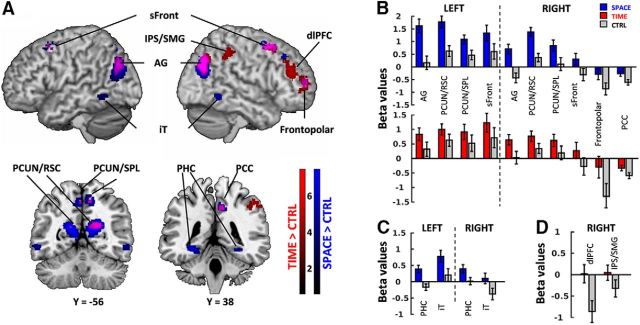
Figure 3.
A, Overlap of brain regions engaged in TIME (red) and SPACE (blue) compared with CTRL, and their conjunction (purple). All clusters are shown at p < 0.001 uncorrected (voxel level) and p < 0.05 FDR-corrected (extent threshold = 35 voxels, cluster level). Color bars represent the contrast t values. Coordinates corresponding to peak voxel activations are reported in Table 3. Brain regions common to TIME and SPACE comprised bilateral AG, PCUN/RSC, and PCUN/SPL, and superior frontal cortices as well as the right PCC and frontopolar cortex. TIME engaged the right IPS/SMG and the dlPFC. SPACE engaged bilateral iTs, bilateral PHG, and right dlPFC. B, Average beta values for regions activated in both TIME > CTRL and SPACE > CTRL contrasts. Most of the overlapped clusters, apart from frontopolar cortex and PCC, showed positive betas. C, Average beta values for regions activated in SPACE > CTRL contrast only. iT and PHC appear to be significantly more activated than the control. D, Average beta values for regions activated in TIME > CTRL contrast only. dlPFC and IPS/SMG are more activated than the control; the contrast is mainly driven by the deactivation in the control task. Error bars represent the standard error across subjects.

