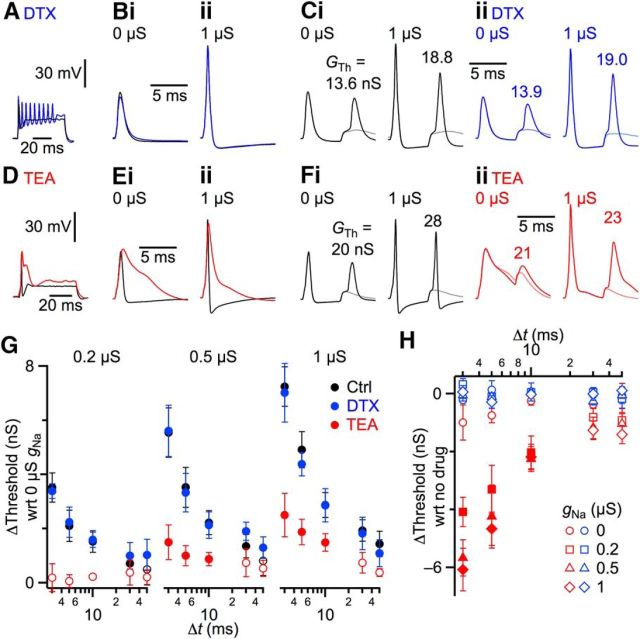
Figure 6.
Recruitment of K channels by somatic gNa. A, D, Representative responses to current injection (600 pA) before (black) and after application of 50 nm DTX (A, blue) or 1 mm TEA (D, red). B, E, Representative APs in control (i) and with 1 μS gNa (ii) before and after DTX (B) or TEA (E) application. AP shape is unchanged in DTX but greatly prolonged in TEA. C, F, Measuring the effects of gNa on conductance threshold. A conditioning suprathreshold synaptic conductance was applied in dynamic clamp, followed by a test conductance of varying amplitude. Each panel shows two traces overlaid, for test conductances just below (light traces) or above threshold (dark traces). Threshold conductances (GTh) are indicated above each trace. i, Traces represent responses without (left) and with 1 μS gNa added in dynamic clamp (right). The same assessment was done in the presence of DTX (Cii, blue) or TEA (Fii, red). G, Summary of multiple experiments showing changes in threshold with different amounts of gNa compared with control (0 μS gNa) before (black, 9 experiments) and after DTX (blue, 4 experiments), or TEA (red, 5 experiments). Threshold increases most at short intervals and with high levels of gNa. Solid symbols represent significant increases in the different conditions at the p < 0.05 level comparing against 0 μS gNa. H, Relative change in threshold after DTX (blue) or TEA (red) application compared with control (no blocker). DTX had no effect on threshold, but adding TEA eliminated increases in threshold. Solid symbols represent significant differences compared with control (no antagonist) in the different conditions at the p < 0.05 level.

