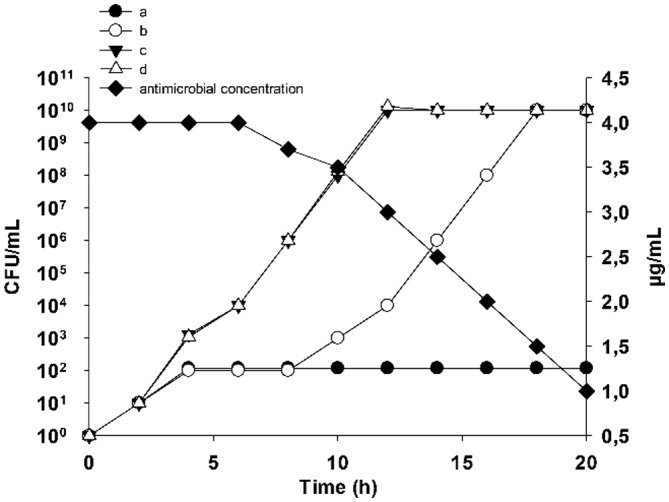
Figure 1. Comparison of the growth curves of different bacteria in the presence of an antibacterial agent added at 4 h. The growth kinetics of a control culture (open triangles), a resistant microbe (filled triangles), a moderately susceptible microbe (open circles), and a fully susceptible microbe (filled circles) are shown. Filled squares represent antimicrobial concentration.

