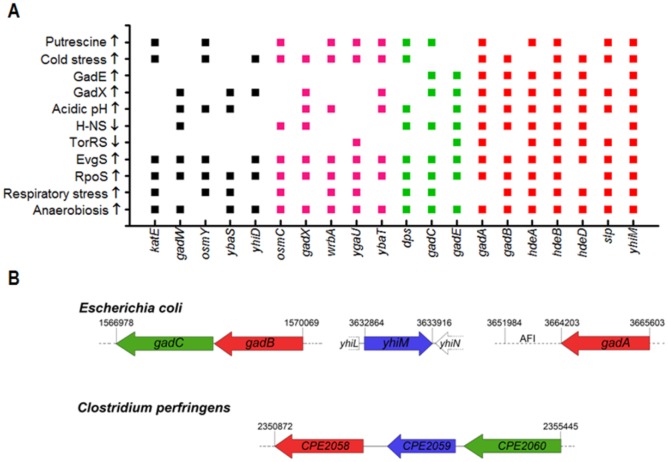
Figure 1. Preliminary observations suggesting that yhiM might belong to the AR circuit.
(A) In the graph the genes found in 5–6 (black squares), 7 (magenta squares), 8 (green squares), 9–11 (red squares) out of the 11 transcriptomic studies taken under consideration [16],[17],[19]–[23],[25],[26],[28],[29],[30] are listed for each group in alphabetical order. The environmental stimuli and the regulators analysed in each transcriptomic study are listed on the Y axis and arrows show up-regulation (↑) or down-regulation (↓) of the reported genes. (B) Schematic representation of the genomic regions containing the gadB, gadC, gadA and yhiM genes in E. coli K12 MG1655 and its homologues in Clostridium perfringens str.13. Orthologs and paralogs are depicted in the same colour for both microorganisms. The 5′ end of the E. coli AFI is indicated.

