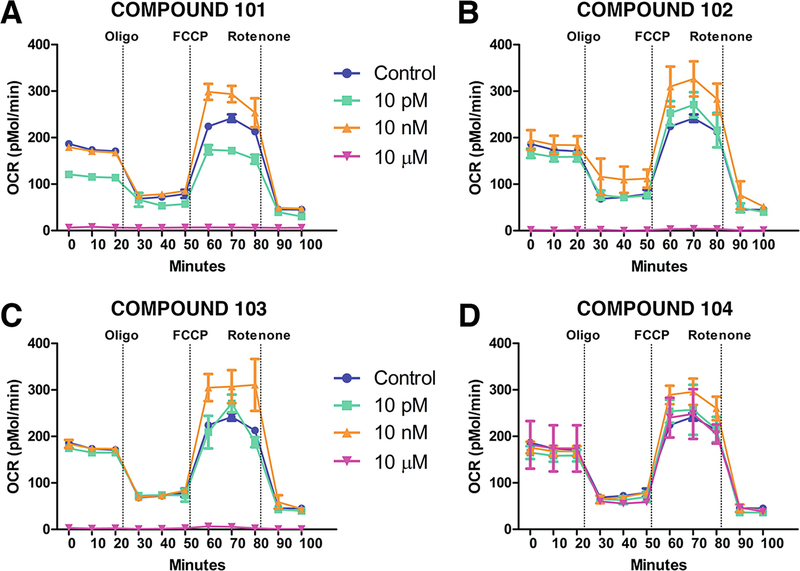
Fig. 3.
Measurement of changes in OCR in response to treatment with different compounds. Representative plots demonstrating the changes in OCR in response to treatment with different test compounds. Each compound was tested in three different concentrations to determine the differential response of drug concentration on cellular OCR

