
Figure 1.
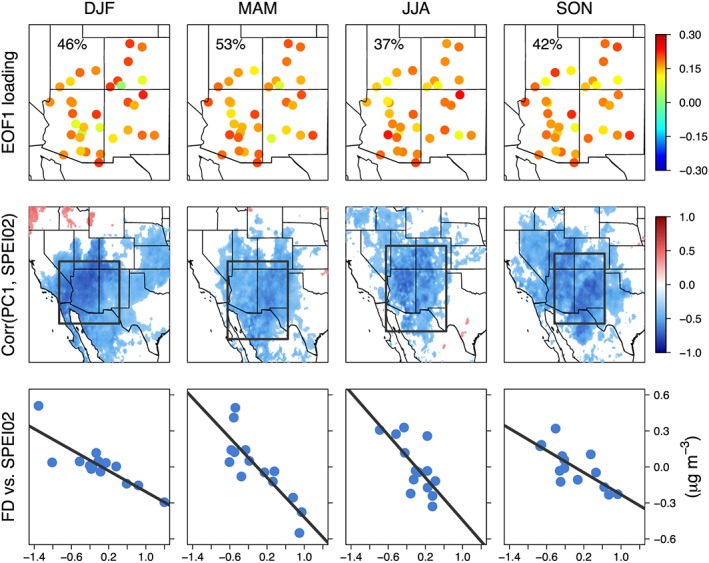
Empirical orthogonal function (EOF), correlation, and regression analysis results for different seasons from 2000 to 2013. (Top row) The first EOF (EOF1) loading of standardized anomalies of detrended and deseasonalized monthly mean fine dust (FD) concentrations measured at 35 Interagency Monitoring of Protected Visual Environments sites in the southwestern United States (31–41°N, 115–103°W). The percentage of total variance explained is displayed inset. (Middle row) The heterogeneous correlation maps between the time series of the principal components of EOF1 (PC1) and SPEI02 anomalies. Only those grid cells with statistically significant correlations (p < 0.05) are shown. (Bottom row) Regional and seasonal mean SPEI02 versus FD anomalies. FD anomalies are averaged across the 35 sites. SPEI02 anomalies are averaged over the domains outlined by the black box in the middle row panels. DJF = December–February; MAM = March–May; JJA = June–August; SON = September–November; SPEI = Standardized Precipitation‐Evapotranspiration Index.