
Figure 3.
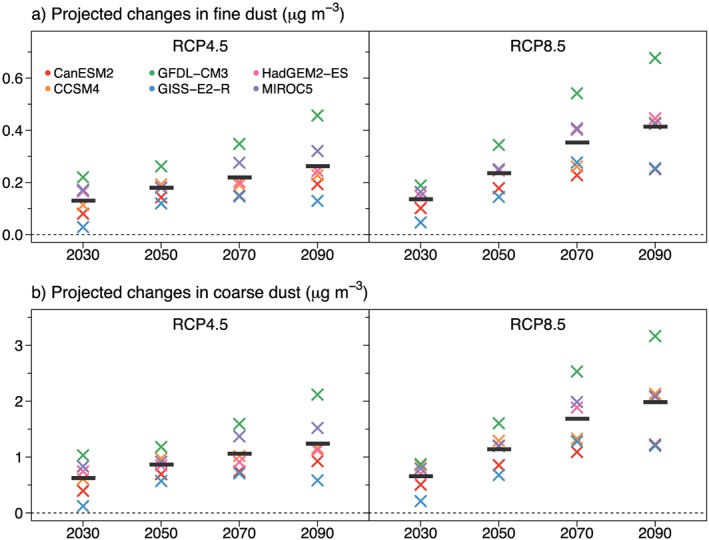
Projected changes in annual mean (a) fine dust and (b) coarse dust averaged over the U.S. southwest under RCP4.5 and RCP8.5 scenarios due to changes in the drought index, SPEI02. Changes are calculated as 20‐year averages centered around 2030, 2050, 2070, and 2090 relative to 1986–2005. Different colored symbols denote results from the six different CMIP5 models, and the thick horizontal black lines show the multimodel means. The multimodel mean values are all statistically significant, as determined by a Student's t test (p < 0.05). RCP = Representative Concentration Pathway; CMIP5 = Coupled Model Intercomparison Project Phase 5.