
Figure 4.
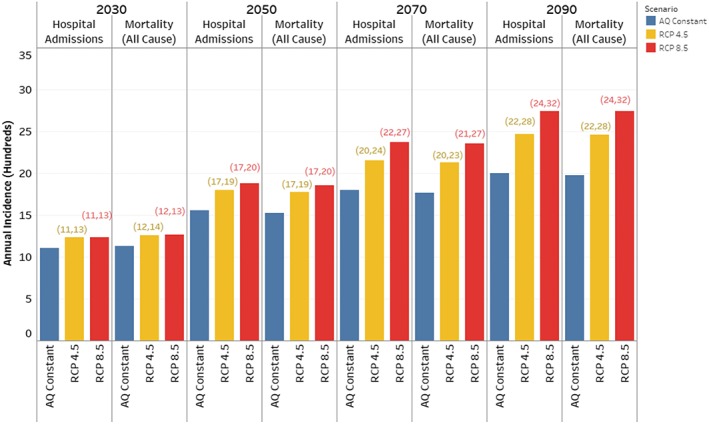
Total annual incidence (sum of reference and excess burdens) attributable to fine dust exposure. The “AQ constant” scenarios (blue) are calculated using 1988–2005 fine dust concentrations combined with projected population and baseline incidence rates. The Representative Concentration Pathway (RCP) scenarios (RCP4.5 = yellow; RCP8.5 = red) consider the combined influence of projected increases in population, baseline incidence rates, and fine dust concentrations estimated from the ensemble mean of six Coupled Model Intercomparison Project Phase 5 (CMIP5) models for each RCP scenario. The health endpoints shown here are the sum of hospital admissions (for adults aged ≥65 years) related to cardiovascular, acute myocardial infarction, and respiratory subgroups, and all‐cause mortality (for adults ≥30 years). The parentheses display the lowest and highest estimates based on the CMIP5 range.