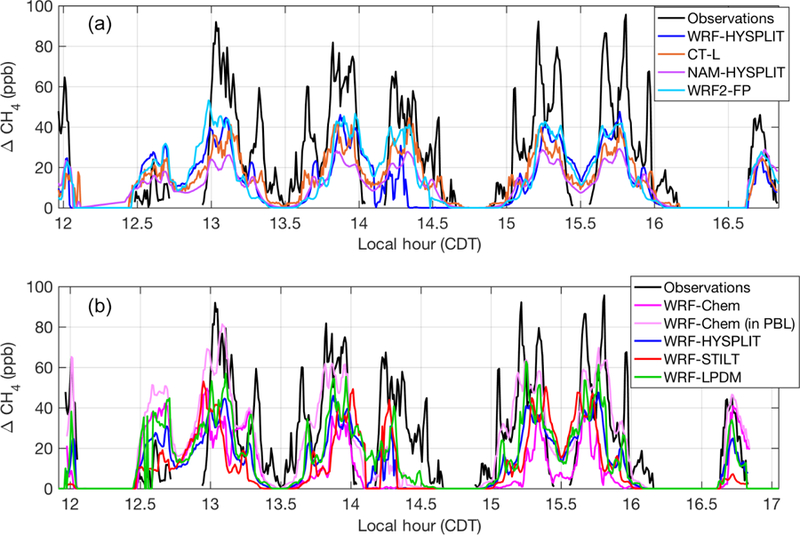
Figure 2.

Modeled (colored lines) and observed (black lines) CH4 enhancements along the flight track on 20131019: (a) models using different transport and dispersion and (b) models using identical meteorological fields (WRF) and different dispersion. The light pink line indicates the values when WRF-Chem is sampled 200 m below the aircraft altitude. WRF-HYSPLIT (dark blue) is included in both plots as a reference point. Local time is Central Daylight Time.
