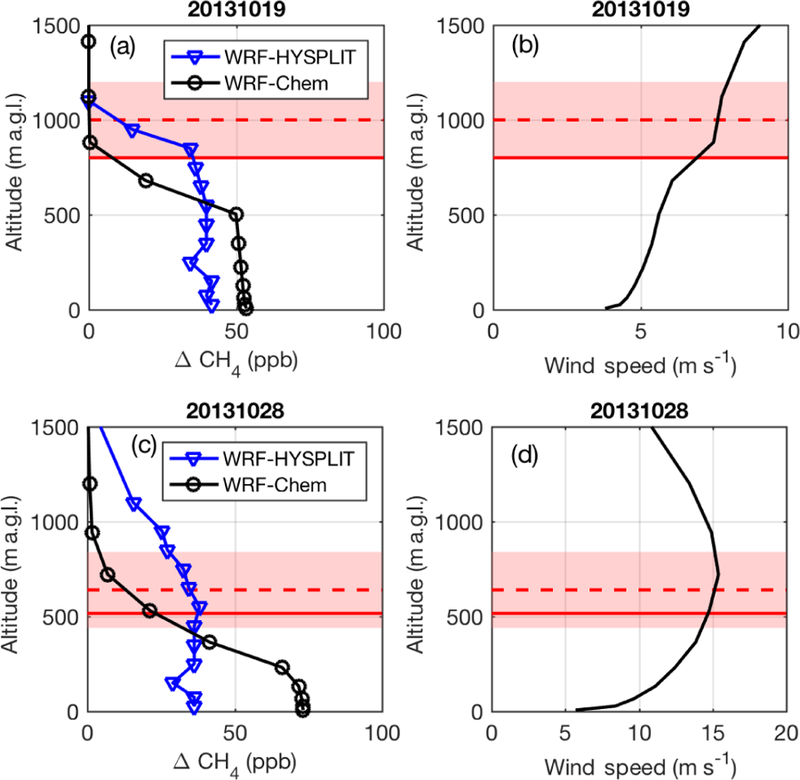
Figure 5.

(a) Modeled CH4 enhancement at a downwind location in WRF-Chem (blue) and WRF-HYSPLIT (black) at 16.00 LT on 20131019 and (c) on 20131028. (b) WRF wind speed profile for 20131019 and (d) 20131028. In all panels, the WRF PBL depth is the solid red line, and the observed PBL is the dashed red line, with the pink shading indicating the uncertainty on the observed PBL (from Karion et al., 2015). Altitudes are given as meters above ground level (m.a.g.l.).
