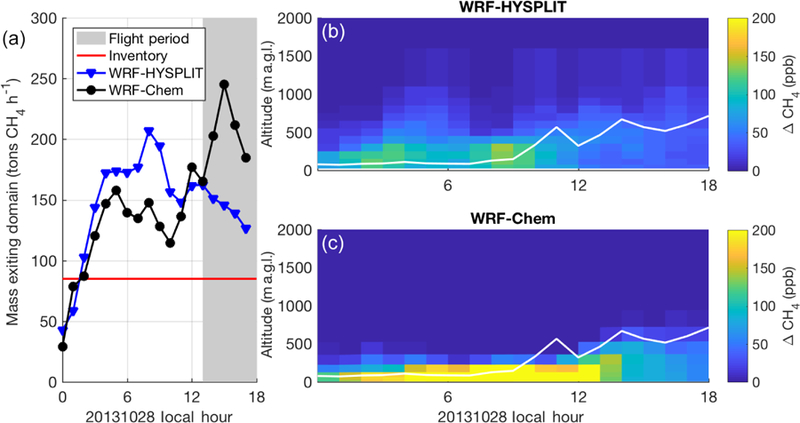
Figure 6.

(a) CH4 flux out of the model domain from WRF-HYSPLIT (blue) and WRF-Chem (black) forward runs on 20131028 as a function of time. The red line indicates the constant emission rate from the surface; gray shading indicates flight period. (b, c) CH4 enhancement at (34.2, −97.7) as a function of height above ground and time of day on 20131028 from WRF-HYSPLIT (b) and WRF-Chem (c). The white line indicates the PBL depth from WRF-Chem.
