Fig. 1.

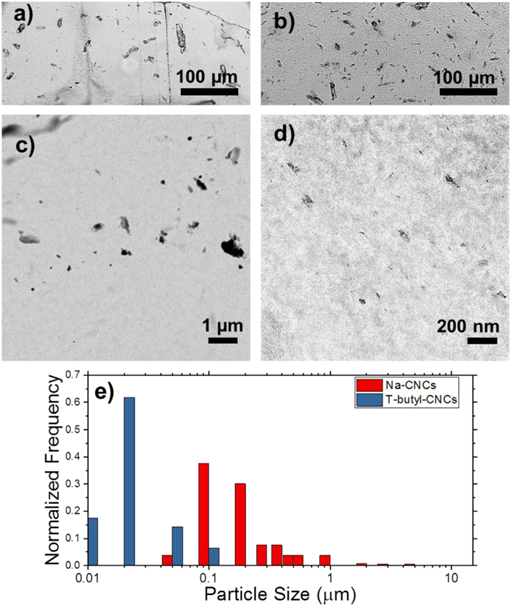
Optical images of a) 5% CNC unmodified and b) 5% CNC modified samples. TEM images of c) 5% CNC unmodified and d) 5% CNC modified samples. The scales are an order of magnitude different for better comparison of the CNC aggregates in the two images e) Calculated particle size distributions for the modified and unmodified samples.
