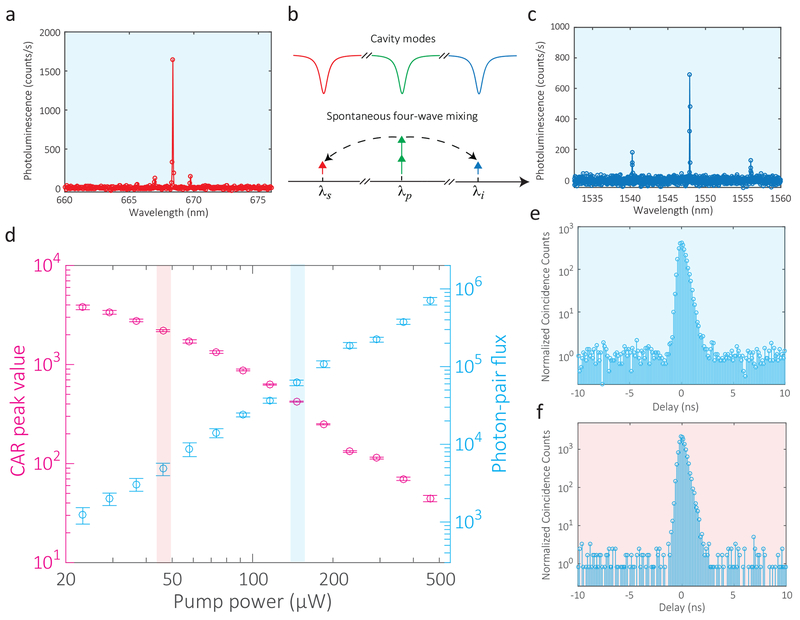
FIG. 5: Visible-Telecom Photon Pair Generation.
a, c, Spectrum of spontaneous four-wave-mixing in the visible and telecom bands, respectively, based on the photon pair generation scheme shown in b. d, Pump-power-dependence of the visible-telecom photon pair source coincidence-to-accidental ratio (CAR) and on-chip photon pair flux. Error bars are one standard deviation uncertainties resulting from fluctuations in the detected count rates, e, f, Coincidence counting trace for the two highlighted points in d (background color matches the highlighting color). The time bin is 128 ps. The mean background level (i.e., accidental counting) is normalized to 1 in these plots.

