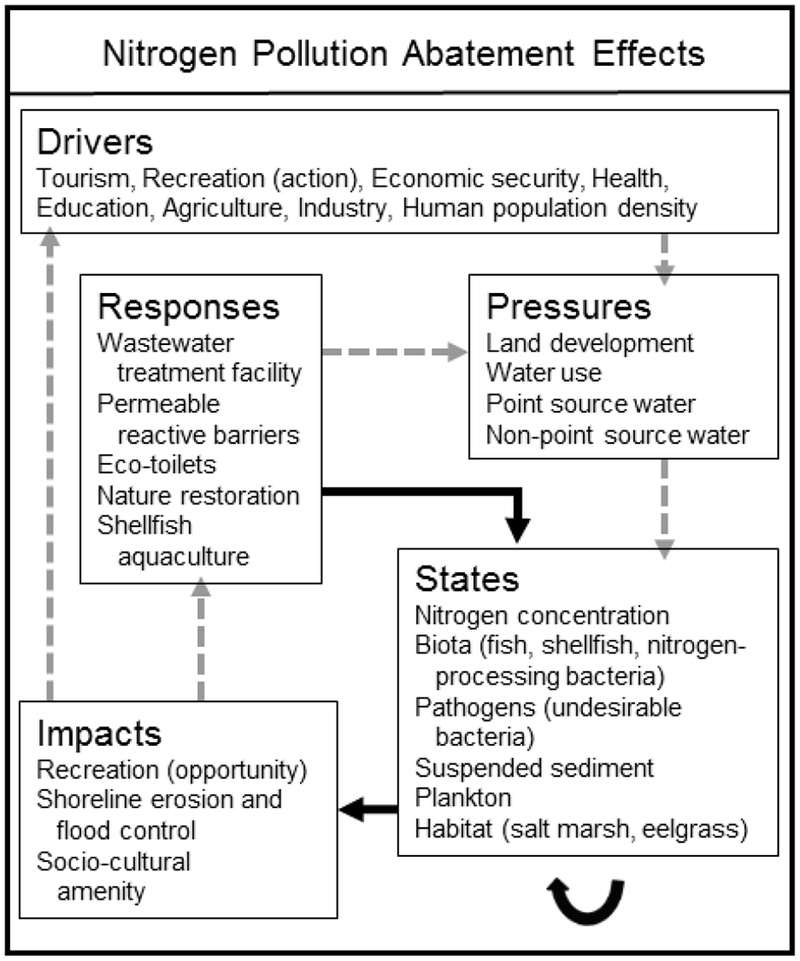
Fig. 3.

Indicators in our DPSIR framework. Arrows depict a conceptualization of how the categories are linked to develop cause-effect relationships. Solid arrows depict the relationships that we used to model qualitative interactions between watershed management responses and ecosystem service impacts. Dashed arrows depict likely relationships among other DPSIR categories but were not used in the analysis.
